


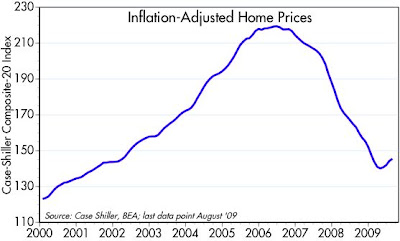

No one seems quite prepared yet to proclaim that we've seen the bottom in housing, but from the looks of this chart the bottom occurred quite awhile ago. After adjusting for inflation (I'm using the PCE deflator here), real home prices have risen four months in a row, at a 12% annualized pace. Since the Case Shiller data involve a lag of several months (i.e., the August figure is the average of prices for the April-June period), it would appear that the bottom in housing prices happened last March. At that point, prices in real terms had fallen by about one-third relative to their all-time high in mid-2006.
Once again we see evidence that markets can solve apparently intractable problems. All it took to fix the housing bubble was lower prices and lower interest rates. Demand is now outpacing supply, as the second chart shows. Skeptics will counter that the rebound is only temporary, because banks have been very slow to put their foreclosed properties on the market, and the government's $8K tax credit for first-time homebuyers is going to be phased out. I can't refute those arguments, but it seems to me that there has been a sea-change in the dynamics of the housing market. Clearly we are no longer in free-fall; there has been a major price adjustment, and there has been plenty of time for attitudes and underlying dynamics to adjust. It is also the case that the broader economic and financial fundamentals have improved considerably in the past six months, and monetary policy has been extraordinarily accommodative for the past year. I think the turnaround in the housing market is for real.
P.S.: Of course, this index is an average of 20 major housing markets, and so it could mask difficulties in one or more areas. Housing is a local phenomenon, and aggregating to national trends is risky. But still I think the evidence is pointing to improvement in a market that has suffered for several years.
5 comments:
Home prices should be up 6% or more YoY by January. Using the historical average monthly price series from 1968-2000 (National Association of Realtors data) sequenced forward from last month, I estimate home prices will be up at least 6.5% YoY in January, 2010. Using from the same period median home prices / disposable personal income and fading up over two years to the historical average, I believe home prices could print a +10% to +14% YoY in H1 2010. I think this will be great for specific companies as well as the structured finance business, banks, and consumer discretionary companies.
Dale: if you are right, and I hope you are, it will surely be good news for a lot of companies.
so what happens if the first time homebuyer's credit isn't extended? Could the rise in prices be due to the rush to get in before the credit expires? Will there be a Cash-for-Clunkers like hangover in December?
Paul,
Well, we'll see, but the historical regression has been median home price =(5.3967*DPI)+6942.8. The number that indicates is $198K+ today vs. the last tick on median home price of $175K. I think there is upside to home prices, especially with the Fannie and Freddie rate locks at 4.75% today (which means you can lock in a 30-year mortgage at 5.0% or so around the country today). That is more than supportive of today's home price.
Paul: I think I agree with Dale. The fundamentals (improving economy, easy money, low interest rates, lower prices, plenty of time for adjustments) all argue for a housing turnaround. The government's 8K credit is a bit player in this drama. Stay focused on the big stuff, not the month to month variations.
Post a Comment