Showing posts sorted by relevance for query 30-yr. Sort by date Show all posts

Friday, February 3, 2012

Tracking the recovery: pessimism still pervasive

For the past three years this blog has been steadfastly of the belief that while the economy was likely to improve, the recovery would be sub-par because of too much fiscal stimulus and too much uncertainty surrounding monetary policy. At the same time, I have repeatedly observed that the market's implied outlook for the economy was overly pessimistic, thus making equities very attractive. And indeed, the economy has been steadily improving, but the recovery has been definitely sub-par. As for the market, I still see signs that it is priced to overly pessimistic assumptions about the future, and therefore still attractive. What follows is a quick recap of some important indicators and how they are evolving:


The ratio of the Vix index to the 10-year Treasury yield is one way of judging how much fear (Vix) is priced into the market, and how much optimism about the future (10-yr) is priced in. Last October this ratio hit a peak as the market braced for a wave of Eurozone defaults, a financial market meltdown, and a double-dip recession. Fear was intense, and the market's outlook for future growth was dreadful. Things have since improved, but there's still a lot of concern expressed in this ratio. The Vix index is still some 40% higher than it would be if the market were calm and relaxed, and the 10-yr yield, at 2%, is still at a level which implies dismal prospects for economic growth. The 10-yr Treasury yield is equivalent to the market's guess for what the Federal funds rate will average over the next 10 years, and it will only average 2% if the Fed keeps the funds rate at or near zero for at least the next several years. And that, in turn, will only happen if the economy remains very sluggish for years to come. If the market believed that today's jobs report marked the beginning of a significantly stronger economy, then it would be pricing in a much more aggressive Fed posture, and that would imply a much higher 10-yr yield.


This chart shows how the ups and downs of fear have been important drivers of equity market performance. On balance, the story of the last three years is simple: the market started out with the expectation that the future was going to be catastrophically bad: years of depression and years of deflation. When the economy started to grow instead of collapsing, the market began to be less fearful, and equity prices rose. We've seen two waves of fear push the market down in the past few years, both caused by concerns over a Eurozone sovereign debt crisis. Yet each time the fears have proved to be overdone, and as fear subsided, equity prices rose.


This chart shows how the relatively steady improvement in the economic fundamentals (i.e., declining weekly jobless claims) has guided the equity market higher. It's hard to argue with improvement in the current fundamentals, even if you remain concerned about the future.


Corporate profits according to the National Income and Product Accounts have never been stronger, yet PE ratios remain very depressed by historical standards, and hugely depressed considering the very low level of Treasury yields (the 7.3% earnings yield of the S&P 500 compared to the 2% yield on 10-yr Treasuries implies a huge equity risk premium). This points to only one conclusion: the market is convinced that profits are set to collapse, perhaps because of a global recession sparked by a Eurozone disaster, and/or because our enormous and growing federal debt burden will crush the economy via a mega-increase in future tax burdens.


I would argue that the Fed's attempts to flatten the Treasury yield curve (by promising to keep short rates near zero for at least 3 years and by selling short-maturity bonds and buying longer-maturity bonds) have very little impact on 30-yr bond yields, because the Fed owns only a very small portion of outstanding, marketable Treasury debt. 30-yr Treasury yields are determined by the market's outlook for growth and inflation, and they are as low as they are today because the market's outlook for growth is still dismal and inflation expectations are unremarkable. However, as the chart above shows, there is a huge and growing disconnect between the rise in equity prices over the past several months, and the continued low level of bond yields. The equity market is grudgingly accepting the view that the economy is doing better than expected, but the bond market is still in the grips of fear. Domestic and foreign investors are still very worried about Eurozone defaults and a financial meltdown, and so the demand for the safety of Treasury bonds is still intense.


The bond market has experienced a rather significant change of late, however, and it shows up in the spread between 10- and 30-yr Treasury yields (the blue line in the above chart). Fed expectations haven't changed much, and that is reflected in 10-yr yields that are still below 2%. But Fed expectations can't keep 30-yr yields from rising as the economy beats dismal expectations. Since early October, 10-yr yields are up 20 bps, whereas 30-yr yields are up over 40 bps. Over the same period, forward-looking inflation expectations have risen from 2.0% to 2.5%, as the market figures that the risk of very low or negative inflation has declined because the economy has proved stronger/less weak than expected.


The market can't be considered to be optimistic about the future until we see that expectations for Fed policy have been radically revised, and that change, if and when it occurs, will show up in a dramatically higher 10-yr Treasury yield. As long as the 10-yr bounces along around 2% (see chart above), we know that the market's outlook for the future remains pessimistic.

Friday, November 12, 2010

The return of the bond market vigilantes


This chart highlights two very interesting developments. I'll begin with the 40 bps rise in 10-yr Treasury yields that has occurred over the past month. 10-yr yields are now about 33 bps higher than they were just prior to Bernanke's late-August unveiling of plans for QE2. What is interesting is that even though the FOMC has now confirmed it will be buying/monetizing up to $600 billion of Treasury bonds of up to 10 years' maturity over the next 8 months, the bond market has decided to stage a protest. That protest has sent 10-yr yields up by 33 bps, and 30-yr yields up by a whopping 80 bps in just a few months.

The Fed can exercise some influence over (a euphemism for manipulate) Treasury yields out to 10 years, but only if it can convince markets that it is embarking on a credible policy to target the overnight Fed funds rate in a particular manner. For some time now, that has consisted in repeated assertions that, because of the large amount of slack or idle resources in the economy, the Fed will keep overnight rates close to zero for a very long time. If the market agrees that the funds rate is likely to be close to zero for a few more years, then investors bid up the price of all Treasuries (and lower their yields correspondingly). The market does this until investors become indifferent between investing at the overnight rate or investing in 2, 5, 7, or 10-yr Treasuries—because they figure they will earn the same amount of interest over time either way. But the Fed has almost no control over 30-yr Treasury yields, since those are determined almost entirely by market forces, which in turn are driven by expectations of future economic growth, future inflation, and future Fed policy actions. (And because 30 years is just way too long for anyone to be able to extrapolate the future course of of all these variables with any degree of confidence.)

So the big rise in 30-yr yields that I have been highlighting for the past few months was the first clue that the market was starting to get uncomfortable with the idea of QE2. Too much money printing would surely cause inflation to rise in the future, and rising inflation would surely (eventually) cause the Fed to raise overnight rates. So why buy bonds that were paying historically low yields with the expectation that the funds rate could be zero for a very long time? The rise in 30-yr yields is a good sign that the fabled "bond market vigilantes" are mobilizing once again. The bond market is not going to be sweet-talked into accepting historically low yields at a time when the Fed is talking about throwing money out of helicopters in order to push the rate of inflation higher.

The next very interesting development shown in the chart above is the relatively tight correlation between bond yields and core inflation over the past several years. In an efficient market there should be a fairly close and predictable relationship between risk-free yields and the underlying rate of inflation in an economy. That's because investors and market participants have the ability to arbitrage between financial markets and physical markets. For example, if prices of most things are rising 10% a year, it wouldn't make sense to buy a risk-free bond that pays only 2% interest—much better to sell low-yielding bonds and buy real estate, gold, and/or commodities. Similarly, in an environment of nearly zero inflation, investors would not long ignore the opportunity cost of not owning risk-free bonds paying 10% interest—intense demand would drive bond yields down to a level more consistent with underlying inflation. Over long periods, it is generally the case that risk-free bond yields are largely determined by inflation.

(Note that the two vertical axes of the chart are offset by 2 percentage points. When the two lines sit on top of each other, that is an indication that Treasury yields are 2 percentage points higher than inflation. This is a way of showing that real 10-yr interest rates—the difference between nominal yields and inflation—tend to be 2% on average over time.)

I say that the chart above is interesting not because it illustrates the well-known relationship between interest rates and inflation, but because it provides evidence that the main reason 10-yr Treasury yields have been so low is that inflation has been low. It's been surprising to me that inflation has remained so low, given that Fed policy has been ultra-accommodative for the past two years, the dollar has been historically weak, and gold and commodity prices have been soaring.

In my defense I could argue, as some do, that inflation has been badly calculated and in reality is much higher than reported. But in my long experience with government statistics I have never uncovered evidence which undermines the credibility of U.S. government inflation calculations (the same can't be said of Argentina, however). So I prefer to think I have been the victim of Milton Friedman's assertion that "the lags between monetary policy and the economy are long and variable." Inflation has fallen more, and for longer, than I have been expecting. But that doesn't necessarily mean I'm wrong, or that interest rates and inflation won't be higher in the future. It could just mean that the lags have been unusually long this time, perhaps due to the nature of the recent recession.

In any event, there is a valid monetary explanation for why inflation has been very low, and it goes back to the events of 2008. The financial crisis was such a shock to consumers and investors all over the world that the world's demand for dollars soared almost beyond comprehension. It took the Fed awhile to recognize this, and to counteract the huge shift in money demand with a correspondingly large shift in money supply. This introduced some serious deflationary pressure into the mix, and that showed up in TIPS breakeven inflation rates that were very low and even negative by the end of 2008. A deflationary shortage of dollars also showed up in a huge spike in the dollar's value towards the end of 2008, and a significant decline in the price of gold and commodities from mid-March through late 2008.

The recent rise in 10- and 30-yr Treasury yields is likely telling us that inflation is finally set to rise. It wouldn't be surprising at all, given how accommodative monetary policy has been and promises to be. There is no shortage of evidence that money is in abundant supply: gold and commodity prices are soaring, the dollar is scraping the bottom of the barrel, and forward-looking inflation expectations built into TIPS prices have risen from 2% to almost 3% in the past several months. If inflation is indeed about to turn up, then no amount of QE2 can keep Treasury note and bond yields from rising. Actual and expected inflation can easily overpower even the most determined efforts of the Fed to keep long-term interest rates artificially low. The Fed is no match for the bond market vigilantes once they are aroused; the $9.1 trillion of Treasury debt outstanding is an order of magnitude larger than the Fed's proposed QE2 purchases.

I sense that the stock market has been getting nervous of late over these same issues. Bond yields are rising, yet the Fed is already in the process of buying bonds. What's going on? Is the Fed on the wrong track? Is the Fed going to wimp out on its QE2 promises? Could deflation return? Could the economy suffer a setback? Lots of uncertainty, and uncertainty is never good for stock prices.

It's often said that the market has a way of surprising the greatest number of people at the most unexpected of times. If that's to be the case once again, then we could be on the cusp of some very surprising developments. The current consensus is so firmly entrenched in the view that the economy is going to be struggling (i.e., the "new normal") for a long time and that inflation is absolutely dead, it would be a real shock if the economy and inflation were instead picking up. The shifting political winds in Washington are already blowing in a more positive "growth" direction, after all.

I'm not afraid of rising Treasury yields, since they would be effectively signaling a healthier economy, the death of deflation fears, and the beginnings of some inflationary relief for underwater homeowners. Before too long, we would probably see the Fed put QE2 on hold, then decide to start raising the funds rate; that would cause all short-term rates to rise, and that in turn would be a very welcome relief to all those who are holding CDs and money market funds. Borrowing costs for individuals and businesses shouldn't have to rise by much, since credit spreads are still much wider than they tend to be during times of healthy economic growth. Rising Treasury yields would be painful for the Federal government, but a stronger economy and new efforts to control federal spending should cause a significant narrowing of the deficit over the next few years.

I'm hoping the rise in inflation won't get out of hand, since that would bring a whole host of problems (e.g., a major Fed tightening followed by another recession). But lots of water has to pass under the bridge before we will need to worry about inflation getting too high.

Wednesday, December 15, 2010

How the bond market vigilantes work


The controversy over QE2 continues, but the real action is in the bond market, where bond yields and inflation expectations are moving up daily, if not hourly.

Before QE2 was even a possibility, yields and inflation expectations were declining from May through August. The fuel for this move was the belief that sovereign defaults in Europe would spread contagion through the global economy that could result in a double-dip recession in the U.S. Weaker growth, in turn, would intensify deflation pressures, thus making 10-yr Treasuries an attractive hedge. So everyone piled into 10-yr Treasury bonds, driving their yield down from 4.0% to 2.5%.

Then the Fed floated the idea of QE2 at the end of August, and everything started changing. Traders began speculating that Fed purchases would create downward pressure on the Treasury yield curve out to 10 years. The market began to front-run the Fed, by buying bonds that the Fed was expected to purchase. By October, the market had driven 10-yr yields down to an extremely low 2.4%.

Meanwhile, speculators were also figuring that QE2 could have inflationary consequences. Normally this would have pushed up yields all across the curve, but savvy traders focused their efforts on the long end, because they knew they would be fighting the Fed if they bought the intermediate part of the curve. So the 30-yr bond came under intense selling pressure, and 30-yr yields soared relative to 10-yr yields, taking the 10-30 spread to by far its steepest level ever: 160 bps. For investors making a yield curve play, a popular strategy was to buy 10-yr Treasuries and sell 30-yr Treasuries in a duration-neutral fashion.

The latest twist in this tale began in November, when the FOMC executed the first of its planned $600 billion in purchases of intermediate Treasuries. Two forces were at work: On the one hand, you had a trader's natural impulse to "buy the rumor, sell the fact." The market had been buying 10-yr Treasuries in advance of QE2, and that had been profitable, so now was the time to start unwinding the trade. On the other hand, you had a tremendous hue and cry coming out against QE2. Criticism of the Fed, and dissension with the ranks of the FOMC hadn't been so intense for as long as I can remember. Maybe QE2 would be shut down or cut short? All the more reason to start reversing the trades that had been put into place leading up to November. So the 10-30 part of the curve flattened with a vengeance, and the 2-10 part of the curve steepened dramatically.

Today the steepness of the various segments of the yield curve has returned to the levels that prevailed earlier this year, before sovereign defaults, double-dip recessions, and QE2 arrived on the scene.

What are we likely to see going forward? Two factors are going to figure large in coming months: QE2 and the strength of the recovery. QE2 is likely to continue to fuel inflation concerns, driving inflation expectations higher. Meanwhile, the economy is likely to strengthen at least moderately, with the extension of the Bush tax cuts adding to the forward momentum that has been building for the past several months. The combination of those two forces will very likely result in higher 10-yr yields, and a steeper 2-10 curve, because rising inflation expectations and a stronger economy not only increase the likelihood that QE2 will be curtailed or aborted, but more importantly, they demand a higher level of Treasury yields.


If the market comes to believe that the economy will grow at a more normal rate next year, then by my estimation (laid out in the above chart) 10-yr yields need to be at least 4%. If in addition to that, inflation expectations continue to rise, then we're talking yields of 5% or so.

I think many observers are misinterpreting the rise in yields, thinking that the market is reacting in horror to the prospect that extending the Bush tax cuts will mean an even-bigger federal deficit. They fail to appreciate that federal revenues are already rising at 10% annual pace, and that this is sufficient, if combined with some spending restraint on the part of the new Congress, to reduce the deficit substantially in coming years. Extending the tax cuts won't affect this picture at all; it will most likely increase the economy's ability to generate jobs, expand the tax base, and lift tax revenues.

The stock market appears to be getting a little spooked by the rise in yields as well, thinking that higher yields will shut down the forces of growth. But that's not how things work. Treasury yields are rising because the economy's prospects are improving, and yields are still quite low from an historical perspective. We've seen very strong growth coexist just fine with much higher yields than we have today. It's also the case that while rising Treasury yields make it more expensive for the government to borrow money, they don't necessarily cause corporate borrowing costs to increase. Credit spreads are still quite generous and they can compress further.

There is nothing here that would derail the forces of growth. The only thing of real concern is that Fed policy may eventually unleash the inflation genie that to date has been quite restrained. That could trigger a new round of Fed tightening that would eventually be bad for the economy, but those are concerns we're unlikely to have to worry about for at least the next year or two.

Tuesday, September 21, 2010

Fed policy restarts the reflation trade


The FOMC's announcement today didn't reveal any signs of panic on the part of the Fed, but it did further open the door to another round of quantitative easing (aka QE2): "... the committee is prepared to provide additional accommodation if needed to support the economic recovery and to return inflation, over time, to levels consistent with its mandate." The market rationally interpreted this to be yet another sign that the Fed would rather err on the side of more inflation rather than less (or deflation). Predictably, measures of inflation expectations rose across the board. Gold has risen some $37/oz. so far this month, reaching yet another all-time high today. Gold is up against almost all currencies this month, but more so against the dollar, since it has fallen about 1.2% against a basket of major currencies.


TIPS are a reliable, if conservative, hedge against inflation, and TIPS yields/prices reached a new all-time low/high today. This is a direct reflection of investors' demands for inflation hedges, just as are record-high gold prices. Real yields on 10-yr TIPS have fallen 20 bps so far this month, while yields on 10-yr Treasuries are up 10 bps on the month; this translates into a 30 bps increase in average annual CPI expectations over the next 10 years. A more sensitive measure of inflation expectations, which is preferred by the Fed, is the 5-yr, 5-yr forward breakeven inflation rate; it has risen by over 50 bps so far this month, to a current 2.54%.


Other sectors of the bond market also reveal a recent increase in inflation expectations. As the chart above shows, the spread between 10- and 30-yr Treasury bond yields is now about as high as it has ever been (on a daily basis, we saw a record-high spread of 124 bps in early August). By insisting that short-term rates will remain low for a long time come what may, the Fed has helped 10-yr yields fall. But investors in 30-yr bonds have little or no reason to worry about what the funds rate will average over the next 10 years (a factor that does weigh heavily on the decision whether or not to buy the 10-yr), and they have decided that inflation risk outweighs carry concerns; as a result, 30-yr yields are up 25 bps on the month while 10-yr yields are up only 10 bps.

So we have now reached the point where the Fed's actions and its talk are definitely boosting reflationary expectations. By the same token, deflationary fears are declining. Monetary policy is "gaining traction," as economists are wont to say. Much as I hate the thought of higher inflation, I am not surprised to see equity prices up almost 9% so far this month. Reflation is good news for the equity market (and for high yield bonds) because a) it perforce reduces deflation risk, and b) it increases expected future cash flows without (so far) causing any significant rise in long-term interest rates.

My sense is that with the economy still on the mend—albeit slowly (i.e., modest growth of 3-4%, enough to bring down the unemployment rate in a very slow and painful fashion), and reflationary monetary policy gaining traction, we are now seeing a virtuous cycle kicking in that will at the very least act to help the economy grow. Consumers and businesses that have been hoarding massive amounts of money (as reflected in 12% decline in the velocity of M2 since the end of 2007) are now feeling increased pressures to unhoard some of that money, releasing it to be spent in a fashion that boosts nominal and real GDP. In the latter stages of this reflation process we would likely see an obvious buildup of inflation pressures, but for now this is of secondary concern.

Wednesday, April 25, 2018

Who's afraid of 3%?

The all-important 10-yr Treasury yield rose above 3% today, and that naturally leads to all sorts of questions. Is it good, or is it threatening? Is the Fed too tight? Is inflation about to rise? Is the stock market at risk? I argue here that on balance it's a good thing, and the only ones who need to worry are those that are betting against the US economy.

Chart #1

Three years ago I predicted that we were in the early stages of a bond bear market, and Chart #1 is one validation of that claim: the multi-year downtrend in yields has been broken. To be honest, however, I was a bit early in my prediction. The bear market didn't start until 10-yr Treasury yields hit an all-time closing low of 1.36% in July '16. Today, 10-yr Treasury yields are trading with a 3-handle for the first time in almost seven years (with the exception of one day, Dec. 31, 2013, when yields reached briefly exceeded 3%). 

Chart #2

Chart #2 shows the history of 10-yr Treasury yields going back to 1925. The great bond bull market began when 10-yr yields hit an all-time high of almost 16% in September '81, and it lasted almost 35 years. Perhaps not coincidentally, my career as an economist began in early 1981 when I went to work for Claremont Economics Institute (CEI). That was just before CEI found itself in the limelight, the result of having produced the Reagan Administration's "rosy scenario" forecast that bond yields and inflation were going to plunge as the economy picked up speed. It took a few years before our forecast was vindicated, though none of us at the time would have predicted that bond yields would be falling for the next three and a half decades. What a ride!

Chart #3

Chart #4

As I see it, the first leg of the great bond bull market that has now ended was driven mainly by lower inflation, whereas the second leg was a function of slower real growth, coupled with fears that very slow growth would lead to very low inflation. Chart #3 shows how it took almost 20 years—from the early 1980s through the early 2000s—for 10-yr yields to close the gap between interest rates and inflation; as a result, real (ex-post) yields fell from very high levels to long-term average levels (1%-2%). As Chart #4 shows, the very low real yields of the past 7-8 years have tended to track the very slow real GDP growth of the current economic expansion. And very low real yields combined with low inflation expectations gave us very low nominal yields up until a few years ago.

Chart #5

Since 1997, when TIPS were first introduced, we have enjoyed daily, market-based measures of forward-looking inflation expectations, and that's better than comparing today's interest rates to last year's inflation. Chart #5 shows the history of nominal yields on 10-yr Treasuries, real yields on 10-yr TIPS, and the difference between the two, which is the market's expectation for what the CPI is going to average over the next 10 years. It's worth noting that the real yield on 10-yr TIPS today is just over 0.8%, whereas the ex-post real yield on 10-yr Treasuries (subtracting the year over year change in the core CPI) is also just over 0.8%. If anything, this suggests the market is confident that the future will be similar to the past, and that the Fed is on a sustainable path to raise short-term rates in line with improving economic fundamentals. 

Chart #6

If anyone should fear 10-yr Treasuries breaking through the 3% barrier, it's prospective homebuyers. Since 30-yr mortgage rates tend to trade about 1½ points above the yield on 10-yr Treasuries, the rise in 10-yr Treasury yields has produced a commensurate rise in mortgage rates, as Chart #6 shows. 30-yr fixed, conventional mortgage rates have been 4.5% or less for the past six years, but now they are moving higher. This is certainly bad news for homebuyers, but is it a bad thing for the economy?

Chart #7

To date, rising mortgage rates have yet to put a dent in the demand for new mortgages. In fact, as Chart #7 shows, new issuance of mortgages (for purchases, not refis) has risen significantly in recent years despite rising mortgage rates. This should not be surprising, actually, since it is rising demand for loans and a stronger economy which are bidding up the cost of borrowed money. The higher rates of the past year or two are not bad for growth because they are the natural result of stronger growth. Higher rates are only bad when they rise in real terms as a result of tighter monetary policy, but that's not the case today.

Chart #8

Chart #9

Chart #8 compares 2-yr US yields with 2-yr German yields. As Chart #9 shows, US yields have soared relative to their German counterparts, with the spread (blue line) now exceeding 300 bps. And it's not just nominal yields that have diverged: German real yields on 5-yr inflation-indexed bonds are -1.4%, far lower than today's 0.73% real yield on US 5-yr TIPS. Very low real yields in Europe are symptomatic of very weak growth fundamentals. That can be seen in the fact that the US stock market has vastly outperformed the Eurozone stock market since 2009, as shown in Chart #10.

Chart #10

Traditionally, as Chart #9 also shows, a wider spread between US and German yields has corresponded to a stronger dollar (shown here as a weaker Euro), because higher US rates usually reflect a stronger US economy. But since the beginning of the Trump presidency, this has not been the case: in fact, the dollar has weakened despite stronger US growth and higher US interest rates. It's mighty tempting to conclude that whereas Trump's policies have contributed to a strengthening of US economic fundamentals, global investors have steadfastly refused to join the party, perhaps because they can't stand Trump the man.

Chart #11

In similar fashion, as Chart #11 shows, since the beginning of 2017 gold prices have risen even as real yields have risen (and TIPS prices have fallen), contrary to the relationship that prevailed prior to 2017, when gold prices tended to track TIPS prices. The message here? The dollar seems awfully weak and gold seems awfully strong given strong US economic fundamentals. 

Dollar bears and gold bulls are the ones who really need to fear the advent of higher US interest rates. Arguably, they have misinterpreted rising US rates (and Trump) to mean bad news for the economy, when in fact they are good news. 

I'd wager that Larry Kudlow will be cheering the return of King Dollar before too long, and that would be a very good thing.

Wednesday, April 5, 2023

The Fed needs to cut rates soon


Since the failure of Silicon Valley Bank almost a month ago, interest rates have fallen dramatically. 2-yr Treasury yields are down 130 bps, 5-yr Treasury yields are down 100 bps, and 10-yr Treasury yields are down 70 bps. This amounts to a pronounced steepening of the yield curve, and that in turn is the market's way of telling the Fed that they are going to have to cut short rates soon, and by a lot. In effect, the bond market has priced in a strong likelihood of significant monetary ease. The only question seems to be the timing: will it come at the May 3rd FOMC meeting, or will it be at the June 14th meeting? I wouldn't be at all surprised if it happened before May 3rd. If I were Fed Chair, I would announce a cut in the funds rate of at least 50 bps way before May 3rd. 

While it's very encouraging to note that swap and credit spreads are largely unchanged in the wake of the SVB failure (i.e., there are still no signs of an imminent recession, and liquidity in general remains abundant), there has been some significant capital flight out of smaller banks and into larger banks, and out of deposits and into money market funds and government securities. Since the end of February through March 22nd, commercial bank deposits have plunged by about $400 billion, according to the Fed. At this rate, it's reasonable to think that by now, deposits have plunged by at least another $200-300 billion, or almost $1 trillion since the end of last year. Depositors are voting with their feet, and they are almost running for the exits. Bank stocks have been hit hard, especially the regional banks. There's a strong whiff of crisis in the air.

As Chart #1 shows, the last time the bond market experienced something similar was in late 2007, just before the Great Recession. That's an uncomfortable parallel to say the least.

Chart #1

The top part of Chart #1 shows the Fed funds target rate (white line) and 2-yr Treasury yields (orange line), and the bottom portion shows the difference between the two. Leading up to the end of 2007, short-term interest rates had been rising as the Fed tightened, but then they began to fall precipitously. Notably, the Fed was very slow to follow suit, though eventually they did. By the end of 2008 the funds rate had fallen from 5.25% to 0.25% and financial panic had spread throughout the world. More recently, over the past year the Fed has been very slow to raise rates, always following the market instead of leading the market, since for way too long they thought that the big rise in inflation was just "transitory." Looking ahead, they will likely have to catch up to the reality of declining inflation and a slowing economy by lowering rates.

Unfortunately, the Fed is notorious for being behind the curve as rates rise, and behind the curve when rates fall. This serves to fuel inflation as it rises, and to crush the economy as rates fall. Today we apparently are watching another re-run of the same, unless the Fed soon wakes up.

For months I have been pointing to clear signs that monetary policy has become tight enough to make a difference in people's behavior. Higher rates increase the appeal of holding cash and bank deposits, and they discourage people from borrowing to buy, say, homes. The housing market has been hit hard: since early last year, applications for new mortgages have plunged by 50%, refinancing activity is down by more than 90%, and the supply of new homes for sale has more than doubled. Nationwide, home prices have fallen since hitting a peak about a year ago. Existing home sales are down 30%. 

The nascent banking crisis only serves to tighten monetary conditions, thus adding to already-existing downward pressure on inflation. Whenever a crisis starts, the public's demand for money (and safety) spikes. If that is not offset by a relaxation of monetary policy (i.e., lower interest rates), then deflationary pressures are the result. 

Chart #2

Chart #2 shows that the percentage of service sector businesses that report paying higher prices has plunged to its lowest level in almost three years. This is powerful evidence that inflation pressures in the all-important service sector peaked long ago (in December '21) and continue to decline. The inflation problem that the Fed is determined to fix is definitely on the mend; lowering rates today wouldn't stop this. Not cutting rates would only increase the downside risks to the economy. The time to ease is before the economy shows obvious signs of weakness, not after.

Quick update on mortgage rates:

Chart #3

Chart #3 shows the relationship between 30-yr fixed mortgage rates and the yield on 10-yr Treasuries. In normal circumstances, 30-yr fixed mortgage rates tend to be about a point and a half (150 bps) above the yield on 10-yr Treasuries. (Think of 10-yr Treasuries as the North Star of the world bond market: the standard against which all other interest rates trade.) If the current spread were 150 bps instead of today's 344 bps, 30-yr fixed mortgage rates would be 4.8% instead of today's 6.7%. Mortgage rates today are hugely inflated relative to where they should be, and that has a powerful and negative impact on the housing market.  They will trade lower only as the market loses its fear of inflation and its fear of an unexpected tightening of monetary policy.

Tuesday, May 24, 2011

Mortgage update -- very cheap


With the recent decline in Treasury yields, 30-yr fixed-rate mortgages are now only inches from their lowest levels ever, and the only way they are going to get much cheaper is if 10-yr Treasury yields decline further.


Rates on 30-yr mortgages are largely driven by the 10-yr Treasury yield, since the duration (a combination of the interest rate sensitivity of mortgage-backed securities and their expected average life) of MBS tends to be similar to that of a 10-yr Treasury. As the chart above shows, the spread between 10-yr Treasuries and current coupon FNMA paper (the effective interest rate that a buyer of MBS receives after origination and servicing costs) is relatively low (currently 87 bps), and judging from the history of this spread, it is unlikely to decline much further. And while on the subject of spreads, the spread between conforming and jumbo mortgages is now 38 bps, which is only slightly higher than the average 22 bps spread which prevailed prior to 2007; in other words, jumbo rates aren't going to drop much unless conforming rates do too.


So if you are waiting for mortgage rates to drop meaningfully from today's levels, you should start praying for a real lousy economy. As the chart above shows, 10-yr Treasury yields have rarely been lower than they are today. They were lower only during the deflation and depression era in the 30s and 40s, during the height of the financial panic of late '08, and last summer, when the market feared the economy was entering a double-dip recession. Right now I don't see signs of a recession, a depression, or deflation, so I've got to believe that 10-yr yields are unlikely to go much lower than they already are.

Borrowing money today at a 30-yr fixed rate to buy a house is just about as cheap as it's ever been, and it's unlikely to get much cheaper.

Tuesday, December 6, 2016

The outlook for interest rates

10-yr Treasury yields have jumped 100 bps in the past 5 months, 30-yr fixed-rate mortgages are up almost 70 bps since August (to 4.0%), and the bond market is convinced that the Fed will raise short-term interest rates to 0.75% at its meeting next week. A good part of the rise in 10-yr yields since their all-time low back in early July was due to an improvement in the economy's fundamentals (GDP growth in the third quarter was 3.2%, up from 1.4% in the second quarter), whereas a little over half of the rise in yields has occurred since Trump's surprise election victory. A further breakdown of the rise in yields reveals that about half was due to stronger growth expectations (real TIPS yields are up about 50 bps), and half was due to higher inflation expectations (which are now up to 1.9-2.0% for the next 5 and 10 years).

So it would appear that interest rates are well on their way to normalizing, right? Well, not exactly. According to the implied pricing of the Treasury curve, the bond market is expecting only a gradual rise in note and bond yields over the next several years—less, in fact, than what has occurred in the past 5 months. Whether this is reasonable or not is the issue confronting investors today. If rates end up rising by more or by less than the market currently anticipates, that could have a big impact on interest-sensitive sectors such as utilities and real estate, both of which have already been hit by the recent and unexpected rise in rates.


The chart above compares the current level of the Treasury yield curve (blue line), with the bond market's implied forward yields (i.e., the future yield which is implied by current yields) over the next 2 and 3 years. Most of the eventual rise of yields is expected to occur over the next year, with the Fed expected to raise short term rates another two or maybe three times (to at most 1.5%) over the next 12 months. Beyond that, the market sees the Fed's target rate rising to at most 2% by the end of 2019, and possibly 2.25% by the end of 2020. 5-yr Treasury yields are expected to rise from 1.84% currently to 2.6% by the end of next year, and 2.8% by the end of 2019. 10-yr yields are expected to rise from 2.4% currently to 2.7% by the end of next year, and 3.1% by the end of 2019. The market expects that it will take at least 7 years for 10-yr yields to rise by 100 bps from where they stand currently.


Now let's put these rates in context. As the chart above shows, 5-yr Treasury yields not too long ago were as high as 5%, at a time when core CPI inflation was funning at 2.5-3% and real GDP growth was 2.5-3%. If that was "normal," then today's 1.8% 5-yr yields should be almost 200 bps higher, given the current level of core CPI inflation.


The current level of real and nominal 5-yr Treasury yields (see chart above) tell us that the market is expecting CPI inflation to average about 1.9% per year over the next 5 years. It's unusual, to say the least, for nominal 5-yr yields (currently 1.8%) to be less than the expected future inflation rate over the next 5 years. "Normally," nominal 5-yr yields are 1 or 2 percentage points above expected inflation. Inflation expectations seem reasonable (the core CPI has increased almost 2% per year over the past 10 years), but the level of nominal and real yields seems unusually low, despite their recent jump. This suggests that the market is still priced to miserably low growth expectations. Which further suggests that if Trump's economic plan ends up providing the economy with a significant boost, it's fair to say the market will be quite surprised, and yields will move significantly higher.


The charts above show how the recent move up in 10-yr Treasury yields has affected 30-yr fixed mortgage rates, which are up about 70 bps from their recent, all-time lows. Mortgage rates are still very low from an historical perspective. They were much higher when the housing market was booming in the early 2000s.

Even with the recent jumps in interest rates, and the Fed's almost certain hike in short-term rates next week, it appears that interest rates are still very low and not expected to rise much more in coming years. If you believe there is a decent chance that Trump's economic policies could get the economy back on a healthier growth track, then you need to be very worried about further unexpected rises in interest rates.

While higher-than-expected increases in 5- and 10-yr Treasury yields would definitely be bad news for bond investors, they would not necessarily be bad news for interest-sensitive sectors of the economy. That's primarily due to the fact that higher-than-expected interest rates would most likely come hand in hand with stronger-than expected growth and possibly higher-than-expected inflation. The negative impact of higher than expected rates on the real estate market, however, could be substantially mitigated by the positive effects of stronger growth and higher inflation. It's not obvious, in other words, whether real estate investors should be worried about higher interest rates. Ditto for the utility sector, where prices have already discounted further hikes in interest rates, but not a further strengthening of the economy.

The key thing to keep in mind is this: if interest rates rise by more than expected, it will almost surely be because growth and/or inflation prove to be stronger than expected. Higher interest rates aren't a threat to growth, because stronger growth will boost interest rates.

Tuesday, August 3, 2010

10-30 spread hits record high


The spread between 10 and 30-yr Treasury bonds has hit an all-time record high of 114 bps, according to my quick review of history. This record curve steepening is not showing up in other areas of the curve, however, and the spread has widened sharply in the past week or so. This could be a signal that 10-yr bonds are benefiting from unusually strong demand, perhaps because the Fed has presumably leaked its intention to reinvest income and principal on its MBS holdings, rather than allow them to reduce its balance sheet. That's a tempting conclusion, but I think there are other things at work as well. 

The curve has been steep for some time now, and that is a classic sign of accommodative monetary policy and, and as such the curve presages a) an economic acceleration and/or b) rising inflation. Either one of those would be consistent with a widening of the 10-30 spread. 

It might also mean that those who were speculating on rising 10-yr yields have had to buy back their short positions, for fear that this presumed change in Fed policy will delay the rise in 10-yr yields. 

Whatever the case, a much steeper curve at the long end almost surely is a vote of no-confidence in the deflation scenario. If deflation were really a strong possibility, then investors would be buying the 30-yr and selling the 10-yr, betting on a flatter yield curve and locking in 4% yields on 30-yr Treasuries.

As I've said many times in the past, anything that diminishes the risk of deflation is automatically bullish from an equity investor's viewpoint. So the bottom line here is that the steepening of the long end of the yield curve is a positive, especially considering how bearish market sentiment appears to be, and how pervasive deflation fears appear to be.

Sunday, December 4, 2022

Lower interest rates to the rescue


A few days ago, Chairman Powell essentially admitted that the Fed will no longer be pursuing an aggressive tightening policy. Since then, key interest rates have registered some significant declines, and that is good news for the housing market, the economy in general, and the stock market. We have probably seen the end of the shortest and most dramatic round of Fed tightening in history.

The Fed was late to see the inflation problem, which is very unfortunate, but they have not hesitated to act forcefully, and it seems to have worked. As almost always happens in the end stages of a Fed tightening, real yields have soared (up almost 400 bps in less than one year), the yield curve has inverted, the dollar has surged, commodity prices have dropped, the housing market has run into a brick wall, the stock market has sunk, and the economy appears set to enter a recession. All, of course, classic signs of very tight monetary conditions—tight enough to bring inflation down, and that is indeed what's happening.

There are some unique features to this tightening cycle which bear attention. Most importantly, there is no liquidity shortage. Liquidity is the lifeblood of the bond and stock markets, because liquidity means that people can easily and quickly trade their positions and adjust their exposure to risk. We all know what happens when someone yells "Fire!" in a crowded theater: panic sets in and the exits quickly jam—casualties occur. But with plentiful liquidity, it's like being in a crowded open-air theater when someone yells fire—you simply walk outside unimpeded. And so it is today; there are few if any signs of the distress that typically accompanies very tight money. Credit spreads are low, especially the all-important swap spreads, which are a gauge of how easy it is for people to buy and sell all kinds of securities and risks in size (see Chart #1 in this post for a history of swap spreads). Credit default spreads are low. Volatility is subsiding. There has been a surge of layoffs, but they are mostly concentrated in tech companies that had become seriously bloated. Unemployment claims are low and job growth has exceeded expectations; in fact, there are more job openings than there are people willing to work. 

Another key difference this time around is that the bout of inflation we have suffered was not the result of Fed policy (it is usually is). It was the result of a massive surge in Covid "stimulus" payments which put trillions of dollars into the hands of people who were still hunkered down and unable to spend it. The result was a multi-trillion dollar surge in bank savings and deposit accounts. Once the Covid scare passed, the liquidity dam broke and a tsunami of price increases spread throughout the economy. 

So it wasn't low interest rates that caused the problem, it was too much government spending. Higher interest rates came to the rescue, giving people and incentive to hold on to their extra cash, and that minimized the spending tsunami. Now, interest rates can decline and help the economy get back on a normal track fairly easily. It won't all happen at once, but the wheels have been set in motion. Meanwhile, M2 is declining, which means that excess cash is being reduced with the passage of time.

Chart #1

Chart #1 shows the level of real yields on 5-yr TIPS. In the past year they have surged from -2% to almost +2%. That's an unprecedented swing of almost 400 bps in a relatively short time frame. That's why this year proved to be the most painful in history for anyone exposed to higher interest rates. Fortunately we appear to be waking up from this nightmare.

Chart #2

Chart #2 shows the national average rate on 30-yr fixed-rate mortgages. This has dropped from a high of 7.3% to now 6.5%: a decline of almost 80 bps in less than two months. This is the first step in making homes more affordable, but it won't be the last. Rates are going to have to decline significantly, and they should, even if 10-yr Treasury yields don't fall further. Chart #3 explains why.

Chart #3

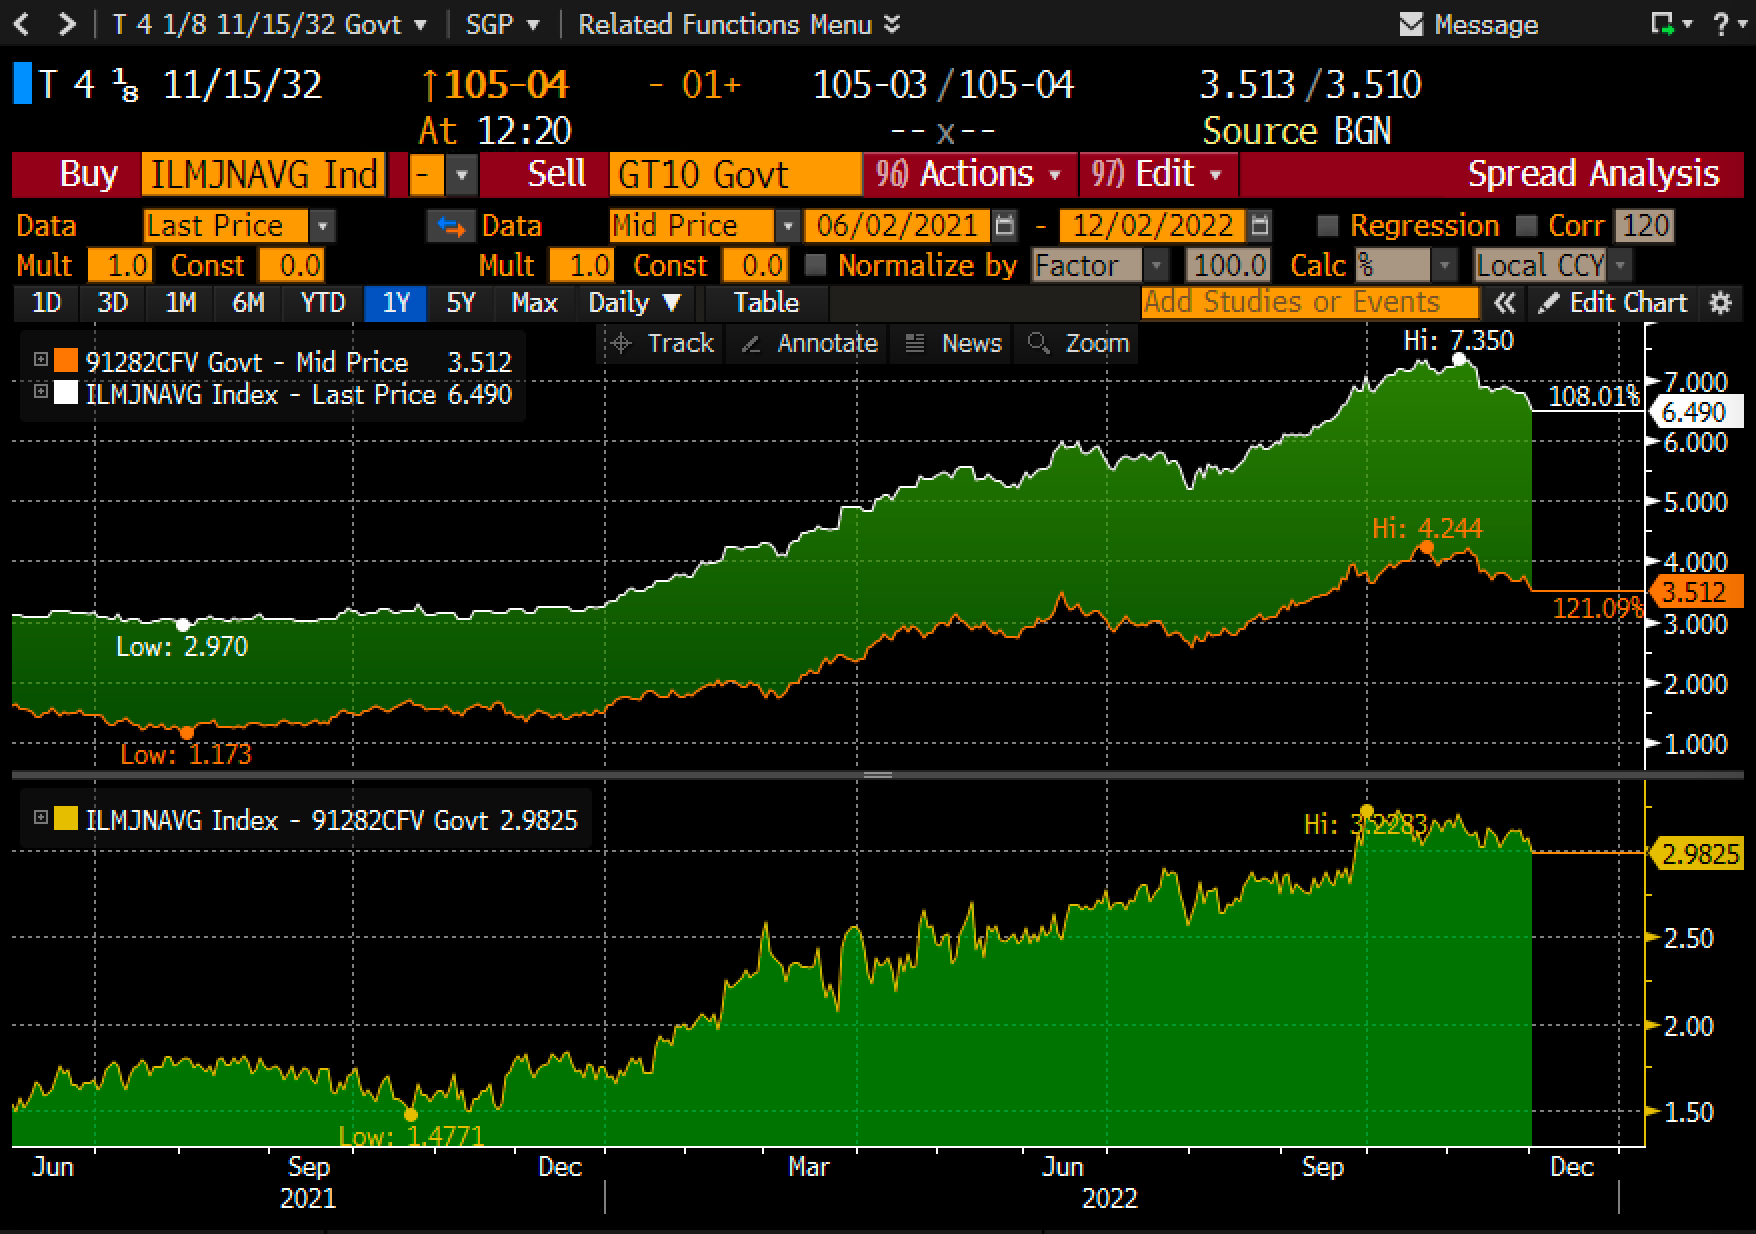
Chart #3 shows 30-yr mortgage rates (white line in the top half of the chart), 10-yr Treasury yields (orange line), and the spread between in the two in the bottom half of the chart. 10-yr Treasury yields are the benchmark for mortgage rates; mortgage rates typically run about 150 basis points above the 10-yr Treasury yield. In recent months, however, the spread ballooned to over 300 bps—twice the normal spread. If 10-yr Treasury yields stabilize around 3.5%, 30-yr mortgage rates should eventually decline to about 5%

Chart #4

Chart #4 shows Credit Default Swap spreads, which reflect the market's assessment of the health of the economy and corporate profits. Spreads are still somewhat elevated, but they have declined impressively in the past few months. This is not what you would expect to see if the economy, as many seem to believe, were on the cusp of a recession. 

While we're on the subject of market fears, it's timely to look at the burden of our surging federal debt, which has now reached $24.6 trillion. You have probably seen many analysts saying it is $34.1 trillion, but that includes $6.9 trillion of intragovernmental holdings which is just an accounting fiction: money that one part of the government owes another. What counts is the debt that our government owes to the public.

$24.6 trillion is still an immense amount of debt. Relative to GDP, our national debt, now about 95% of GDP, was only once higher, at the tail end of World War II. Back then it got to almost 125% of GDP, but the world didn't end. In fact, after WWII, our debt/GDP ratio plunged as the economy boomed. It might seem improbable, but there is no a priori reason it can't happen again.

Chart #5


Furthermore, it is not inevitable that all this debt will push interest rates higher, thus imposing an impossible burden of debt service as many fear mongers are arguing. As Chart #5 shows, it would appear that a rising debt/GDP ratio can occur with lower interest rates, not higher. And a falling debt/GDP ratio can even correspond to higher interest rates.

Chart #6

Chart #6 shows the burden of our national debt, which is the cost of servicing the debt as a percentage of GDP. I've estimated what it will be by the end of this year. And as you can see, it will still be very low from an historical perspective because interest rates are still relatively low. If interest rates stabilize or decline from current levels, and the economy remains reasonably healthy, the debt burden is unlikely to reach unprecedented levels. 

It all depends on how the economy behaves—how much inflation we have and how much growth. Higher inflation shrinks the burden of debt, because it can be paid back with cheaper dollars. A stronger economy boosts tax revenues, which helps support debt repayment. And in any event, paying back the debt is not equivalent to flushing money down the toilet. Every dollar of interest paid on our debt goes into someone's pocket. It doesn't disappear from the economy.

What's bad about our national debt is not the amount of debt that must be serviced, it's what was done with the money we borrowed. Therein lies the real burden of debt. If the money borrowed is squandered, then that places a huge burden on an economy that has not become more productive or more efficient. Unfortunately, a huge portion of our current debt (about $5-6 trillion) was money that was borrowed—or printed—and then handed out to the public. Using debt to finance spending is terrible, since it doesn't enhance the economy's productivity. We essentially wasted $5-6 trillion that might have been better spent on investments that create jobs. The real burden of that debt will thus be paid by future generations, in the form of a slower-than-average rise in living standards. 

Tuesday, February 1, 2011

Yield curve slope hits another new high


The spread between 2- and 30-yr Treasuries reached another new, all-time high today of 401 bps. As this chart suggests, it's not unusual for the yield curve to steepen coming out of a recession. This is typically driven by Fed easing, as the Fed attempts to provide more money to help the economy recover, and to compensate for the higher demand for money that usually follows in the wake of recessions. One side effect of a steeper yield curve is that this becomes fertile ground for bank earnings. Today, banks can borrow from the Fed at 0.25% and, if they choose, buy 30-yr Treasuries, thus helping to fund the federal deficit while also earning 3.75% net interest on the trade. If the mark-to-market risk of 30-yr Treasuries (which currently have a duration of 17.4, and thus stand to lose about 17.4% of their value if yields rise 100 bps) is too much, then banks can buy 10-yr Treasuries (which the Fed is supposedly going to be backstopping for the next 5 months, and which have only half as much price risk as 30-yr Treasuries) and pick up 3.25%.

In effect, what this says is that the Fed is greasing the skids for a lot of folks and a lot of banks and businesses. Corporate profits are already close to record highs, so it is not too hard to understand why the equity market is up 25% since the end of August.

The next shoe to drop will be a pickup in inflation. Recall that the CPI rose from a low of 1% in mid-2002, as the 2-30 slope passed 300 bps on its way to 360 bps in mid-2003, to reach a high of 4.7% in Sep. '05.

Wednesday, September 29, 2010

Thoughts on quantitative easing


Ever since the Aug 10th FOMC statement—in which the Fed announced it would be buying longer-term Treasury securities with the proceeds of its maturing or prepaid Agency and MBS holdings—there has been a very interesting and tight correlation between the slope of the Treasury yield curve from 10 to 30 years and the market's own inflation expectations. This is shown in the above chart, with the red line representing the 5-yr, 5-yr forward inflation expectations embedded in TIPS securities, and the blue line representing the slope of the Treasury yield curve from 10 to 30 years.

What stands out is that the slope of the longer end of the yield curve is now a good proxy for the market's inflation expectations. That is at it should be, of course, since the higher inflation expectations, the greater the premium that investors should demand to own 30-yr bonds instead of 10-yr bonds. But it hasn't been that way for some time. And as the next chart shows, the slope of the 2-10 portion of the yield curve has been trending down all year even as inflation expectations have perked up. Plus, the flattening of the 2-10 portion of the curve has occurred under very unusual circumstances. (Typically, the curve flattens when the Fed pushes up short-term rates, and it steepens when the Fed lowers rates. For some time now, the Fed has kept short-term rates steady at very low levels, while longer-term rates have been falling.)


So the behavior of the yield curve is telling us something important, namely that the Fed's purchases of (and intention to continue purchasing) longer-term Treasury notes is having an impact. The Fed is artificially depressing yields out to 10 years, and that's not surprising because that's what they are aiming for. The Fed believes that lower long-term yields will be stimulative for the economy.

Whether the Fed's purchases of bonds will prove to be a stimulus for the economy remains to be seen, of course. Since early August, lower 5-yr and 10-yr Treasury yields have not resulted in any significant decline in mortgage rates, for example, because the spread between Treasuries and mortgage rates has simply widened. This is not unusual at all, it is simply the market saying that it doesn't believe lower Treasury yields are permanent, and/or it doesn't think that buying mortgages at lower yields is likely to prove profitable. And even if the Fed were able to drive mortgage rates to artificially low levels, I think it's questionable at best whether this would prove to be a stimulus for the economy.

Artificially low borrowing costs are part of the reason we're in the mess we're in. Cheap credit, among other things, helped fuel the housing boom, which eventually went bust. Flooding the system with money could help bail out underwater homeowners by pushing up home prices, but only at the cost of another round of reflation (perhaps housing prices, or in some other area of the economy, who knows?). Plus, it's hard to convince people to borrow these days, when so many are still smarting from having borrowed too much some years ago.

But I suppose that if the Fed tried hard enough for long enough, it would soon become apparent to intelligent people that taking out a whopping big mortgage was a good way to become rich. Borrow now at a super-low fixed rate for 30 years, buy a bigger home or some other tangible asset, then sit back and wait for the price level to rise and reduce the cost of repaying your loan. If enough people decide to borrow more, that translates into a reduction in the demand for money, and that has the effect of increasing the amount of money in the system relative to the prices of goods and services. It shouldn't be hard to see how that would in turn result in a higher price level for just about everything. It won't, however, result in any material change in the economy's ability to grow, since growth only occurs when the productivity of labor rises—when we collectively produce more for a given amount of effort.

I think the bond market is already thinking along these lines, and that is why the long end of the yield curve is steepening. The Fed may be able to depress 10-yr yields by promising to keep the funds rate at zero for an extended period of time, but there is no way the Fed can convince investors to buy 30-yr bonds a ridiculously low yields. Savvy investors are figuring this out: quantitative easing is going to push up inflation, so the thing to do is to shun long-term bonds (or borrow at long-term rates), and buy tangible assets or other currencies. Did I mention that gold and other currencies are already rising? And that's why the steepening of the long end of the curve is indeed a good sign that quantitative easing is going to lift inflation.

Along the way to higher inflation—which could take years to show up—this Fed exercise in quantitative easing may have at least one salutary effect, and that will be to vanquish the widespread fears of deflation. Convincing people that holding onto cash yielding zero is a bad idea is one way of boosting the velocity of money, and that is in turn a way of boosting the economy, if only because velocity has been very depressed. People have been hoarding money since the financial crisis erupted, and the hoarding continues to this day. That has depressed growth in the economy, which is another way of saying that fear of the future and risk aversion are not compatible with healthy growth.

I'm not condoning a QE2, however. I am hopeful, in fact, that it will not prove necessary, and I think that will become obvious as more signs of economic growth show up in coming months.

Tuesday, March 10, 2026

Jobs and War: the Fed needs to ease


The February jobs report was a lot weaker than expected (-92K vs an expected +130K). But viewed from a broader perspective, it's just more of the same slower growth that we have seen over the past year. Jobs numbers are notoriously volatile to begin with, and on top of that, in February most of the country was hit by a huge winter storm while a nursing strike resulted in a loss of 28K health care jobs.

Chart #1

Chart #1 shows the monthly change in private sector jobs (-86K in February). These are the jobs that really count. Notice how volatile they have been in recent years. Almost every move up or down in the monthly numbers has been reversed in the subsequent month, and after-the-fact revisions are frequent and can be huge. I've been arguing for many years that you can't draw conclusions from one month's jobs numbers—you have to look at the underlying trend in the numbers. 

Chart #2

Chart #2 is a more the sensible way to look at these data: how do they change on a year over year and a 6-mo. annualized basis? The 6-mo. annualized change in private sector jobs has been consistently low (between 0.2% and 0.4%) since last June. Viewed from this perspective, today's number was just more of the same slow growth that we've been seeing since last summer. Closing the border has resulted in a big slowdown in jobs growth, but not a crash landing. The economy is most likely experiencing a soft landing which will be followed by a pickup in growth once the uncertainties of the Iran War are resolved, and the world learns to love AI-fueled productivity.

As we await further developments on these fronts, the following charts are "green shoots" that augur better times ahead.

Chart #3

Chart #3 shows an index of housing affordability (a function of interest rates, home prices, and incomes). For most of the past four years housing has been very expensive for almost everyone, thanks to high interest rates, soaring home prices, and modest real income growth. Fortunately, the most recent datapoint suggests that things are beginning to turn for the better, albeit slowly.

Chart #4

Chart #4 compares the level of 30-yr fixed mortgage rates to an index of new applications for mortgages (i.e., excluding refinancings). Here it is easy to see how high mortgage rates depress the demand for new mortgages, and how lower mortgage rates in the past six months have resulted in a modest uptick in new mortgage applications. Things are improving on the margin, but it's going to take a long time before we see a boom in the housing market. Too many people are still locked into 3% mortgages and are thus reluctant to give them up; at the same time, many millions of new buyers are locked out because mortgages are still quite expensive. 

One potential source of optimism: Trump is said to be considering the elimination of the capital gains tax on real estate. This would likely result in more homes for sale and for lower prices, since sellers could lower their asking price knowing that they won't have to pay a capital gains tax. 

For that matter, Trump ought to go the full nine yards and reduce or eliminate the capital gains tax on all asset sales. At the very least he should allow people to index their cost basis for inflation. Taxing inflation gains is morally unjust. Ah, you say, but wouldn't lower capital gains taxes result in a huge increase in budget deficits? No, on the contrary! It's important to remember that the capital gains tax is the only tax that one can legally avoid—forever—simply by not selling an appreciated asset. Cutting the capital gains tax would likely result in a surge in capital gains tax collections. I for one would celebrate this by selling some highly appreciated stock in order to redeploy the funds elsewhere. 

Cutting or eliminating the capital gains tax would provide a powerful boost to economic growth by making homes more affordable and by freeing up capital everywhere that is locked into appreciated assets. 

Chart #5

Chart #5 compares the rate on 30-yr fixed mortgages to the level of the 10-yr Treasury yield, which traditionally has been the main determinant of mortgage rates. Two factors are behind the lower mortgage rates of recent months: lower Treasury yields and lower spreads. Since the Covid crisis the spread between the two has been high and volatile, but it has returned to relatively "normal" levels over the past year. Thus, to get a meaningful decline in mortgage rates going forward, Treasury yields are going to have to do the heavy lifting. The case for lower Treasury yields depends on lower inflation expectations and an easier policy stance from the Federal Reserve.

Consider this: the Iran War has caused a huge increase in uncertainty in the world, not least by interrupting the flow of oil. Any increase in uncertainty tends to increase the demand for money, because people on the margin try to reduce their risk in exchange for cash or cash equivalents. If the Fed does nothing to change the supply of money (such as by lowering interest rates), an increase in money demand will result in a tightening of monetary policy. That in turn will create deflationary pressures and likely disrupt or slow economic growth.

The Fed should not worry that higher oil prices will be inflationary; they should worry that Iran War uncertainty that is not offset by easier monetary policy will be contractionary. 

Chart #6

Chart #6 shows the latest ISM survey of service sector purchasing managers. This is arguably one of the most bullish indicators of late. With 3 stronger readings in the past 3 months, it's a good bet that the economy's largest sector is improving.

It pays to remain optimistic.

UPDATE (3/13/26): Rising uncertainty and a general increase in volatility are working to increase yields across the board. Spreads between 30-yr fixed mortgages and 10-yr Treasuries are already so compressed that 30-yr fixed mortgage rates have nowhere to go but up in this environment: in fact, they recently ticked higher, from a multi-year low of 5.98% to 6.11%. The Iran War is now working to undermine the US housing market.