Showing posts sorted by date for query sub-par recovery. Sort by relevance Show all posts

Wednesday, November 10, 2021

Recession risk is very low, but inflation risk is high


The Fed, not supply chain bottlenecks, is to blame for a significant rise in inflation. If the Fed were targeting low and stable inflation correctly, supply chain bottlenecks would result in an increase in some prices, but not all. Think of stable monetary policy as putting the economy on a fixed spending budget; if you spend more on some things, you perforce need to spend less on others. Today, consumers have a super-abundant spending budget which is allowing a wide variety of price increases, some of which are sizable. (How many prices are declining these days? Offhand, I can't think of any.) This inflation episode is not transitory, it is semi-permanent, and it will last until the Fed decides to tighten monetary policy, an event which still resides uncomfortably far into the future. Unfortunately for Biden, his administration will carry the burden of the blame for higher inflation; unfortunately for consumers, they will carry the burden of paying for the Fed's mistake.

Unfortunately, the bond market is still in the early stages of pricing in the likelihood of higher inflation. Interest rates are thus likely to rise further, and this will periodically weigh on asset prices because it increases the chances of a significant tightening of monetary policy which would inevitably lead to another recession. Fortunately, this risk is not imminent because the Fed has taken great pains to insist that it won't happen for at least another year or two. 

Curiously, the bond market is currently pricing in the expectation that the outlook for economic growth in the US will be dismal. We can see this in the exceptionally low level of real yields on TIPS. I, however, remain convinced that growth will be stronger than expected, just as inflation will prove to be higher than expected. Regardless, I continue to believe that the future path of economic growth in the US will be sub-par; that is what I forecast in 2009, and that continues to be my forecast. Sub-par growth is the natural result of a burdensome tax and regulatory environment which began under the Obama administration and is now with us again in the Biden administration. 

Regular readers of this blog will know that the events I'm describing are unfolding in an unsurprising fashion. I first noted the huge jump in M2 in May of last year, and how it could boost inflation if the Fed failed to respond to a subsequent decline in money demand. In August of last year I inaugurated the mantra "borrow and buy," as the best way to profit from easy money and rising inflation. In practice, that meant avoiding cash and buying assets with roots in the nominal economy (e.g., property, commodities, and productive assets such as equities). Last March I said the Fed was too easy, and I also wrote about the problem of unwanted money. I argued last April that rising inflation was not temporary. Last May I said the Fed was playing with fire. Last June I wrote about my experiences with inflation while living in Argentina, and how it was a lesson for the US. I emphasized last July that inflation had broken out to the upside. A month ago I described monetary policy as a slow-motion train wreck. 

So here we are today: despite all its exhortations to the contrary, the Fed has made an inflationary mistake which it's very unlikely to correct anytime soon. (In fact, monetary policy has never been so easy.) And despite the economy's rather impressive recovery this past year (both real and nominal GDP are now higher than just before the Covid shutdowns began), the market remains convinced that the future of economic growth is bleak. 

I'm more pessimistic than the market about the outlook for inflation, but I'm more optimistic about the outlook for growth. As a result, I'll stick with "borrow and buy" until real interest rates rise significantly. I'll avoid cash and embrace debt; I'll be a seller of bonds rather than a buyer; and I'll be a buyer of property and equities. 

What follows are my customary charts which illustrate many of these points.

Chart #1

Chart #1 (M2 less Currency) is the virtual elephant in the room: the biggest story not being told. The explosion of the US money supply since March of last year is unprecedented and widely unremarked. There is now some $4 trillion of extra money sitting in retail bank, checking, and savings accounts in the US—above and beyond the amount we would have expected to see at this time. At first, all this extra money was fine, since the public's demand for the safety of money was intense in the months surrounding and following the Covid shutdowns. But now that the economy is chugging along and almost fully recovered (more on that below), there are trillions of dollars that are no longer wanted. As consumers attempt to spend down their money balances, they simply push prices higher. High inflation will be with us until this begins to change, and that is not going to happen soon, so swears the Fed.

Chart #2

Chart #2 shows the 6-mo. annualized increase in the CPI (both total and "Core" versions). I believe this is the best measure of the rate at which inflation is currently running, and it hasn't been this high since the early 1980s. At this rate the CPI should post at least a 7% rise for the current calendar year.

Chart #3

Chart #3 illustrates how changes in housing prices impact the CPI with about an 18-month lag. The big rise in housing prices began in the middle of last year and now we're just beginning to see how this is contributing to a rise in the rental portion of the CPI (which is about one-third of the total CPI index). (It takes time for higher home prices to feed into higher rents.) This means that today's higher housing prices will contribute to higher inflation for at least another year. 

Chart #4

Chart #4 shows the ex-inflation version of consumer price inflation. It makes sense to strip out energy prices since they are by far the most volatile component of the CPI. Yes, gasoline prices have surged, but so have a lot of other prices. In the past six months, this measure of inflation has risen at a 6.3% annual rate.

Chart #5

Chart #5 shows nominal and real 5-yr Treasury yields, and the difference between the two (green line), which is the market's expectation for what the CPI will average over the next 5 years. Inflation expectations by this measure have surged from about 0.5% in mid-2020 to now 3.1%. That's a huge increase, but it's still far below where inflation is running currently. The bond market has been slow to catch on to the rising inflation seeds that the Fed has been sowing for the past year. Expect all of these lines to rise further in the future. 

Chart #6

Chart #6 strongly suggests that interest rates are still far below where they should be given the current level of inflation.

Chart #7

We all know there is a chip shortage which has seriously hampered the ability of factories to turn out new cars. At the same time, consumers' appetite for buying cars has surged, thanks at least in part to the $4 trillion of "unwanted" money that consumers have been accumulating in their bank accounts over the past 18 months. The result is an explosion of used car prices unlike any we've ever seen before (see Chart #7). This speaks loudly to the thesis that there is simply too much money these days chasing too few goods. A classical case of rising inflation. 

Chart #8

Chart #8 shows us that over half of the small businesses in the US are reporting paying higher prices for a wide variety of things. We haven't seen conditions like this since the high-inflation 1970s. If there weren't an excess of money out there, higher prices for some things would perforce result in lower prices. Thus, the current inflation episode is very unlikely to prove transitory. It won't end until the Fed hits the monetary brakes, and that won't happen until we see real and nominal interest rates move up in a big way.

Chart 9

Chart #9 shows the finished goods version of the Producer Price Index (as contrasted to the final demand version which has become more popular in recent years). Here we see an astounding 12% increase in the past year. This foreshadows more inflation in the pipeline for the CPI, since producer price hikes tend to be passed on to consumers.

Chart #10

Chart #10 is a new one for me, inspired by a similar chart in a recent version of Steve Moore's daily newsletter. The different lines represent different age cohorts. The green line represents the mature segment (over 55) and it's also the most productive (due to experience). Youngsters (the blue line) have almost all gone back to work, but a whole lot of older folks have not. As he notes, "Older workers who dropped out of the workforce when Covid hit (they were the most vulnerable) have not come back." 

Charts #11 & 12

The reason for this looks to be related to all the transfer payments lavished on the private sector. 

Chart #11 shows transfer payments (e.g., social security, welfare, food stamps, medicare, unemployment benefits, subsidies, etc., all of which are income received not in exchange for work) as a percent of disposable income. Incomes were hugely boosted by lavish benefits and profligate subsidies voted by politicians in an attempt to mitigate the damage caused by shutting down the economy. 

Chart #12 shows the labor force force participation rate (the age-weighted average of the lines in Chart #10). Funny how the surge in transfer payments in the wake of the 2008-09 Great Recession coincided with the beginning of a big drop in labor force participation, and how the same thing happened last year in the wake of the massive wave of Covid payments.

Big transfer payments are thus one reason the economy is likely to grow at a sub-par pace going forward: millions of our most productive workers are staying at home, either retired or living off their Covid-era savings.

Chart #13

Chart #13 compares the value of the dollar (inversely represented by the blue line) and an index of industrial commodity prices. These two lines tend to move together, since a stronger dollar tends to depress commodity prices and vice versa. There's been a huge divergence in this relationship in the past year, however, as the dollar has been fairly steady against other currencies but commodity prices have surged. A possible explanation for this is that the global economy has rebounded very strongly from the Covid slump, resulting in very strong demand for industrial commodities. This is corroborated by strong capital goods orders in the US, and a noticeable increase in manufacturing activity. This foreshadows continued economic growth both here and in the rest of the world, and thus it casts doubt on the bond market's apparent belief (as shown in the form of negative real yields) that future growth will be dismal.

Chart #14
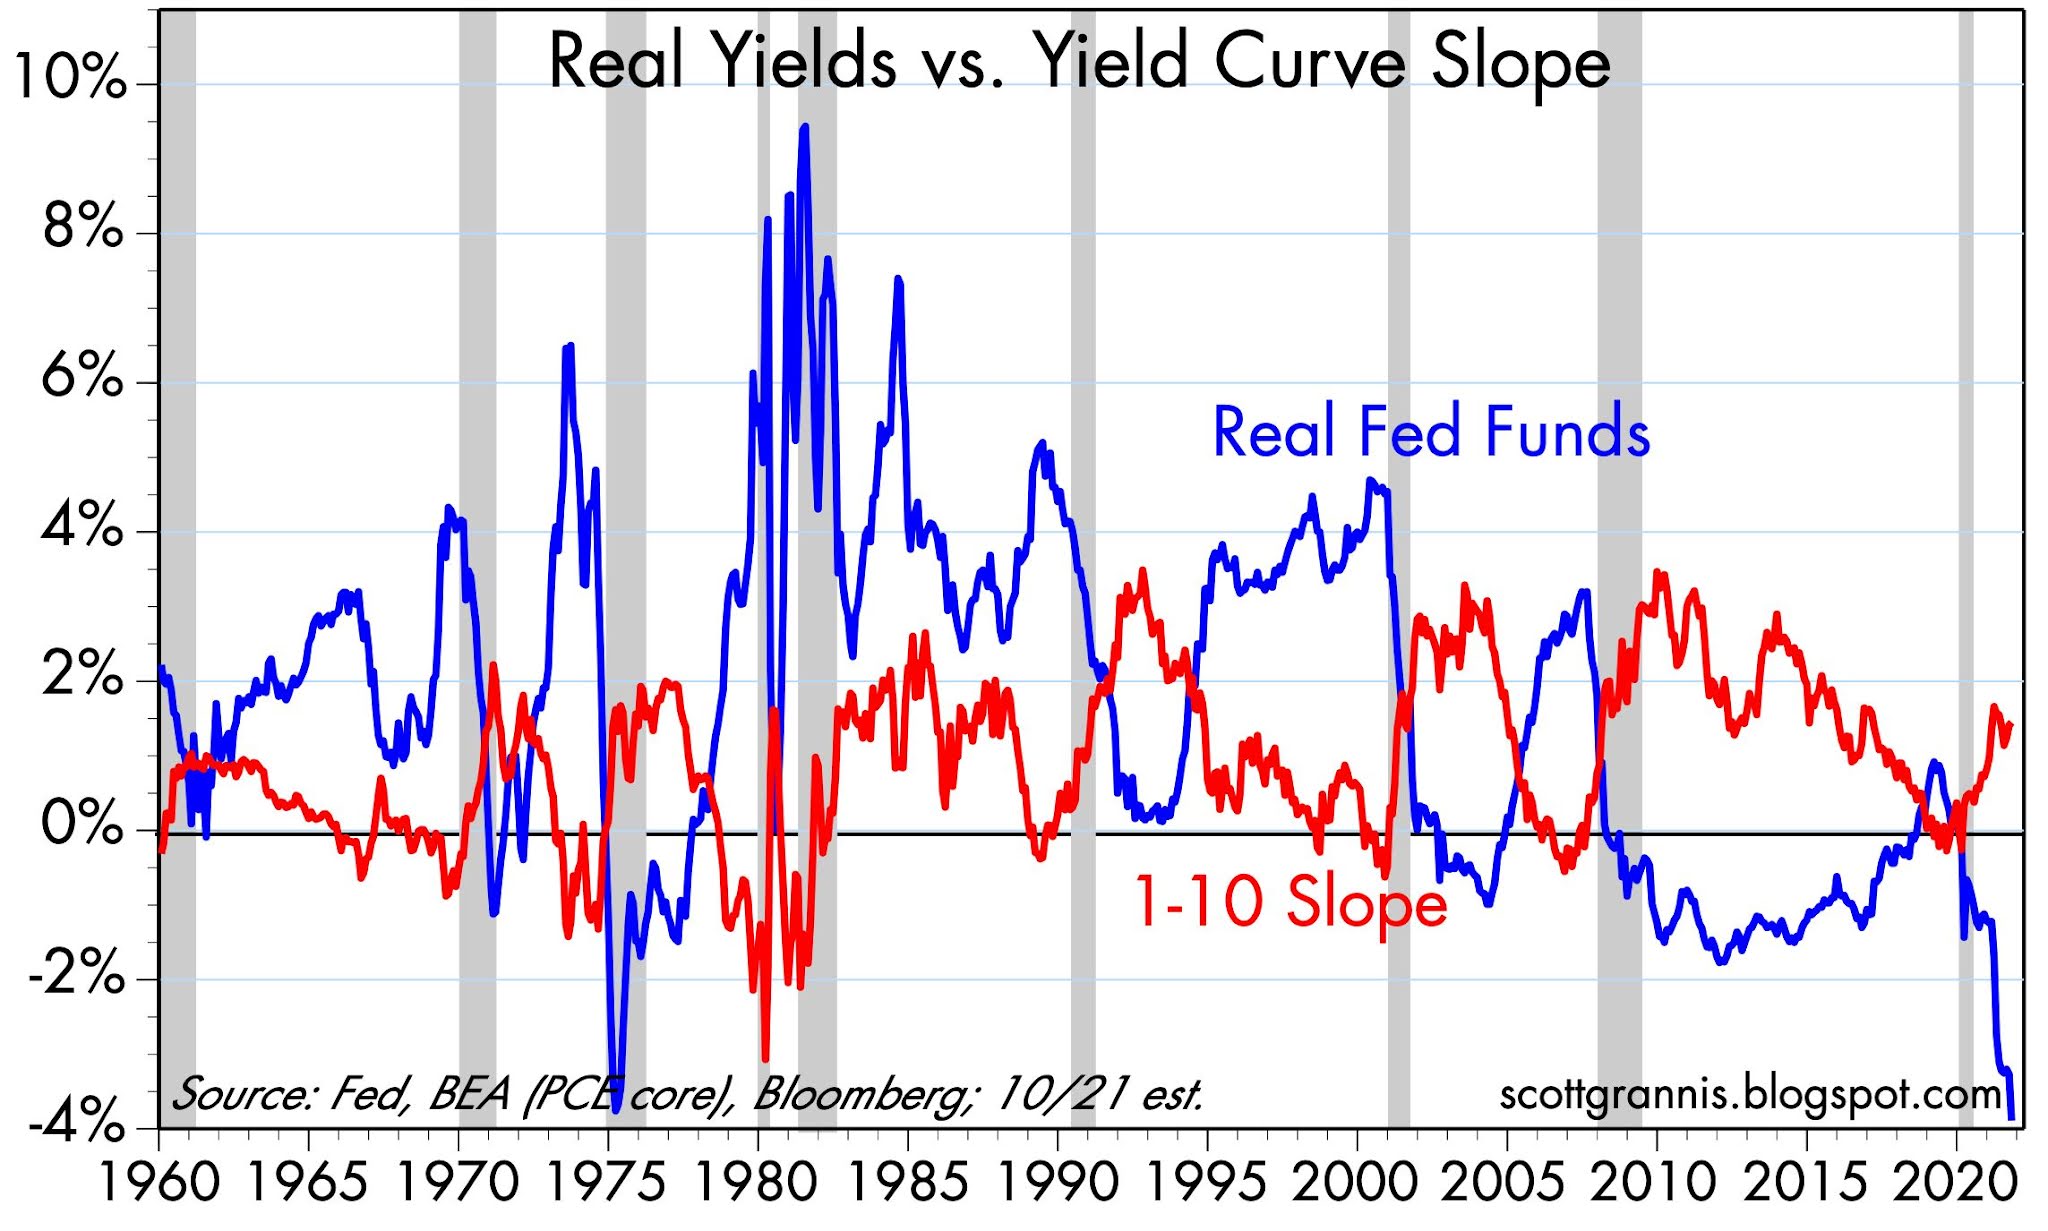
Chart #14 suggests that it is too early to worry about the negative consequences of future Fed tightening for stocks and the economy. With the exception of last year, every recession in my lifetime has been preceded by very high real interest rates (blue line) and a flat to negatively-sloped yield curve. Neither condition holds today. Indeed, this chart today suggests that the future looks bright. Unless the Fed does an about-face soon, it could be years before real interest rates are high enough to depress economic activity. In the meantime, credit spreads are very tight and liquidity is super-abundant. 

Consequently, the outlook for corporate profits is still quite positive, and the economy is nowhere near the brink of another recession.

Wednesday, February 3, 2021

Keep on borrowing and buying

Despite a catastrophic decline in GDP in the first half of last year, the US economy managed to stage an almost complete rebound in the second half. By the end of 2020 the economy was only 2.5% smaller than its year-end 2019 level. Most observers expect at least a few more strong quarters of growth, which will almost certainly allow the economy to break new high ground within the next several months.

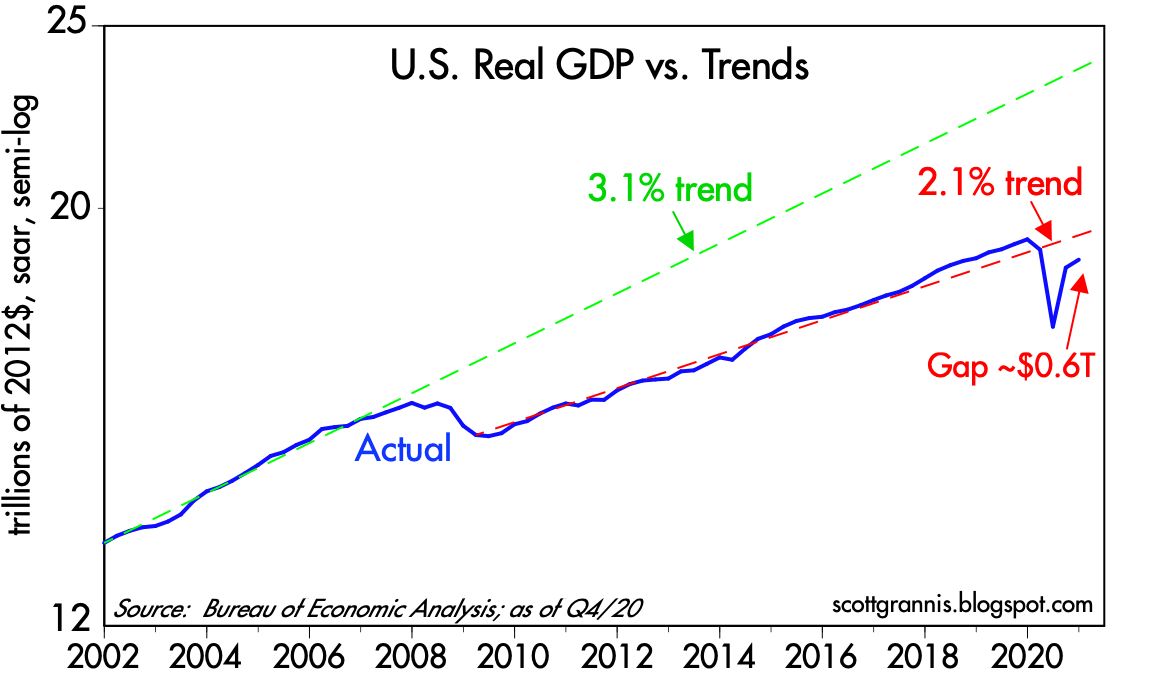
Unfortunately, economic growth is not about to set any long-term records. For 50 years, from 1966 through 2007, the US economy grew at an average annualized rate of about 3.1%—a great and dynamic expansion which saw the economy almost quintuple in size. The came the Great Recession of 2008-9. Not only did the economy fail to recover to that long-term 3.1% trend in subsequent years—for the first time ever, following a recession—it went on to post only slightly more than 2.1% annual growth in the decade from 2009 through early 2019. It was the weakest economic expansion on record, and it looks set to continue for the foreseeable future, I'm sorry to say.

Chart #1

Chart #1 uses the magic of a logarithmic y-axis to show how the US economy followed a 3.1% annualized growth track for 50 years. (With a logarithmic y-axis, a line with a constant slope represents a constant rate of growth.) Then, beginning in 2009, it managed to grow only 2.1% per year for the subsequent decade. (See this post for more details as to why.) We've been living in a sub-par recovery since I first anticipated it back in early 2009, thanks to too much regulation, high taxes, and too much government spending. Those same forces will act as headwinds for the economy in the years to come, with Biden promising a virtual replay of all of Obama's anti-growth policies—and possibly even more. Slow growth has left the economy substantially weaker and smaller (by about $4.5 trillion per year, as shown by the gap between the blue and green lines) than it might have been had the prior 3.1% growth trend persisted. 

Chart #2

Chart #2 is similar to Chart #1, but it zooms in on just the past two decades. The green line shows the same 3.1% trend growth rate that features in the first chart. The dashed red line shows the trend that persisted throughout the Obama years and into Trump's first year. Note how the economy perked up a bit in 2018 and 2019 as Trump's policies boosted growth above the 2.1%, a period which culminated in record-breaking real household median income growth, as shown in Chart #3.

Chart #3

The US economy would need to grow by 5.2% (after inflation) this year in order to reattain its 2.1% trend growth by the end of this year (see Chart #2). Most analysts are optimistic, but few, if any, expect growth to exceed 5%. I wouldn't be surprised if it did, however, but I would not expect to see more than 2% annual growth beyond this year, especially if Biden manages to implement his green energy policies and higher taxes on wealth and business. Looking long-term, we're likely to be stuck in a slow-growth world, much as we've seen over the past decade or so.

Chart #4

Near term, though, growth should be pleasantly robust, as the economy emerges from its Covid travails and a return of confidence boosts consumer confidence and business investment (see Chart #4, which shows capital goods orders, which are a good proxy for business investment). There's a lot of slack in the economy that will be put back to work as the Covid problem slowly recedes; already, daily new Covid cases are declining nearly everywhere and vaccinations are proceeding at an impressive pace. At the same time, Covid-related restrictions have forced the economy to do more with fewer resources, thus providing a one-time boost to productivity, which surged at a 7.5% annualized pace in the second and third quarters of last year and likely closed out the year on an unusually strong note.

Chart #5

Not all is sweetness and light, however. Chart #5 compares the real yield on 5-yr TIPS to the 2-yr annualized growth rate of GDP—not surprisingly, real yields tend to track the real growth potential of the economy. With 5-yr real yields now abysmally low (-1.8%), we can infer that the market sees very little growth potential for the US economy in the years ahead. A charitable interpretation of this chart would suggest the market expects real economic growth to average about 1-2% per year for the foreseeable future. Thus, although my expectation for 2% annual growth seems rather modest in an historical context, I'm only essentially agreeing with the market's expectations.

This modest growth outlook would ordinarily not provide much support for equity prices. However, in the context of a zero-percent cash environment, equities still have a better expected return than cash or cash equivalents. And with the Fed seemingly determined to keep short-term rates very low for a long time (the market currently expects the Fed funds target rate to remain roughly unchanged for the next two years), the inflation-adjusted return on holding cash is going to be negative for a long time. Holding cash is virtually guaranteed to be a losing strategy in terms of purchasing power. And that effectively boosts the demand for just about anything and everything other than cash and short-term bonds. Equity, commodity, and real estate prices are all rising, and that's not surprising given the Fed's policy stance.

Chart $6

A final note: inflation expectations embedded in TIPS and Treasury prices are now approaching 2.33%, as Chart #6 shows. This cannot go on much longer, I fear. Sooner or later Treasury yields are going to have to start rising. But in the meantime, it pays to borrow, since interest rates are so low relative to inflation, and it pays to buy, since expected returns on non-cash assets are much higher. It's not unreasonable to think we are in the early stages of an inflating "asset bubble."

All of these considerations leave me nervously optimistic about the long-term outlook for equities. I don't think the Fed's desire to boost inflation is consistent with a long-term healthy economic outlook, because higher inflation will eventually undermine confidence and the economy. Unprecedented monetary expansion in recent years has not yet resulted in any significant increase in inflation, but only because the demand for cash has been extremely strong. Sooner or later the Fed will get its way and money demand will fall (market sages are fond of saying you should never bet against the Fed's ability to get what it wants, and I think they are right). But just how long the Fed can undermine the world's demand for cash and avoid an unhealthy increase in inflation is really the only issue at this point. If the Fed doesn't thread this needle just right, inflation expectations could become "unmoored," and that eventually would lead to a significant tightening of monetary policy which in turn would most likely result in yet another recession somewhere down the road.

Meanwhile, "borrow and buy" should continue to be your mantra, even if it makes you nervous. 

Tuesday, November 17, 2020

More V-shaped signs

The latest economic data available continue to show signs of a strong recovery from very-depressed lockdown levels. Economists have known for a long time that, in general terms, the deeper the recession the stronger the recovery. This axiom was disproved, however, when the recovery following the Great Recession of 2008-09 proved to be quite sub-par. I've commented on that many times over the years.

Chart #1

Today's release of the November Homebuilders' Sentiment Index (red line in Chart #1) was almost literally off the charts. We've known for some time that the housing market was doing exceptionally well since mid-year, but this makes it clear. It also suggests that housing (and related industries) is going to be doing gangbusters in the months to come. Lots of upside potential in the housing market, helped to no small degree by super-low mortgage rates and an abundance of available credit. 

Chart #2

Industrial production in the US surged from its lows, but gains in recent months have been more tempered. But as Chart #2 shows, industrial production in the US has enjoyed a much stronger recovery than in the Eurozone. Still lots of room on the upside in both regions.

Chart #3

World trade, shown in Chart #3 (but with a regrettably long lag) has clearly rebounded strongly. This is critical for nearly every country, since global trade has been a very important engine for growth and prosperity. 

Chart #4

The outlook for China has been improving for most of the past year, as reflected in the strength of the Chinese currency (blue line in Chart #4). It's important to compare the yuan's strength and weakness to the level of China's foreign exchange reserves, since this can tell us what is driving the yuan's value. In this case we see that forex reserves have been relatively steady for about the last four years. Meanwhile, the yuan's value has fluctuated considerably. What this shows is the China's central bank has not been manipulating its currency. It's maintained a relatively neutral policy stance, allowing net capital flows to drive the currency higher or lower. In the past year, capital inflows have apparently been quite strong, and since the central bank was not trying to absorb these flows (by creating more yuan and thus expanding forex reserves), the inflows resulted in a stronger yuan. In other words, strong demand for the yuan coupled with a relatively fixed supply of yuan caused the value of the yuan to rise. This most likely means that people have been more inclined to invest in China and/or less inclined to disinvest in China. 

Chart #5

Capital inflows and increased confidence have also driven the value of Chinese equities higher, as we seen in Chart #5 (blue line). A Biden presidency is much more likely to be friendly and supportive of China than Trump's has been, and the market has picked up on that. Whether this is a positive long-term development for the US remains to be seen, but in general terms whatever is good for China is good for the world. At the very least this is yet another sign of the market's "risk-on" behavior of late.

With all this good news, it pays to keep an eye on what might go wrong. My #1 pick for a nasty surprise would be the Democrats gaining control of the Senate by capturing both of Georgia's Senate seats in an early January runoff election. That would strongly tilt the balance of power to the left, whereas the current state of affairs equates to a rather benign "divided government." Government is sometime best when it governs least, as the old saying goes.

I don't expect the Democrats to regain control of the Senate (hardly anyone does, it seems), so for the time being I remain an optimist. The Fed is not about to do anything that might harm the recovery, and the federal government is not going to try to implement a Green New Deal (which would be a futile and hugely expensive undertaking that would only harm US competitiveness while doing virtually nothing to address climate change). A divided government is quite likely to avoid economy-killing tax increases, but Biden will probably manage to reverse some of Trump's beneficial de-regulation policies. I think this paints a picture of an economy that will continue to flourish in the short-term (think V-shaped), but over the longer haul will follow the same sub-par growth path established during the Obama years.

Tuesday, October 27, 2020

Entering the home stretch with hugely mixed signals

As we enter the home stretch in what could prove to be a monumentally important election, I doubt that any honest observer has strong convictions regarding the election's outcome. The implications for the economy are potentially huge: a second term for Trump arguably could put the economy back on a stronger growth track, while a Biden presidency coupled with a Democratic Senate majority would likely give rise to significant obstacles to growth such as much higher tax rates, more regulatory burdens (e.g., an end to fracking and eventually the entire petroleum industry), enormous compliance costs for green energy initiatives, expanded income redistribution efforts, and a more activist industrial policy. If the market expected a Biden/Democrat sweep, I have to believe that stock prices would have been trending lower in recent months, instead of higher. Yet the polls appear to overwhelmingly support a Biden win, as do the betting markets. In any event, never in my lifetime have we had so personally polarizing a president as Trump, and never before have we seen the mainstream media so vociferously, overwhelmingly, and blatantly in support of the challenger—and so antagonistic to the incumbent. 

The personalities of Trump and Biden could not be more opposite. Trump is a hardscrabble billionaire businessman devoid of social graces, while Biden is the epitome of a career politician, albeit one with a checkered past and few if any significant accomplishments. It's not surprising that both have skeletons in their closets, but the Democrats and the press spent most of the last 4 years trying in vain to dig up evidence of Trump's malfeasances while ignoring Biden's. The Democrats went on to impeach Trump over a supposed quid pro quo phone call, but now evidence is surfacing of the Biden family's ties to Chinese business interests and apparent influence peddling. Trump is bursting with energy, while Biden is suffering from old age and the beginnings of dementia. Trump has shaken off the Covid virus while maintaining an active schedule, while Biden has been hunkered down in his basement for months in fear of that same virus. Trump's rallies are many and massive, while Biden's are few and subdued. The "enthusiasm gap" hugely favors Trump, while the polls and the pundits hugely favor Biden. Trump chose a competent and successful person to be his Vice President, while Biden gave the nod to an unliked and unimpressive woman because she ticked the politically correct race and gender boxes. In the end, Biden's strongest selling point is that he is not Trump.

To make matters worse, it's possible that we won't know the results of the election for an unbearably long time. Potential risks cloud the horizon in almost every direction, but the market is not ignoring this. Risk aversion is still abundant and visible, especially in the levels of the Vix index and Treasury yields. And yet the economic statistics of late paint a very promising picture of a V-shaped recovery. I'm cautiously optimistic, as I explain below.

Chart #1

Chart #1 shows how rising fears have accompanied market declines. The Vix index, currently just over 33, is significantly higher than what we have observed during times of relatively tranquility (i.e., 10-15), but substantially less than the panic levels we saw at the outset of the Covid crisis. The market is worried, but not in a panicked sense. 10-yr Treasury yields, however, are very near their lowest level in all of history, as are real yields on TIPS. Inflation expectations, in the meantime, are "normal," averaging about 1.7% for the foreseeable future. Low nominal and real yields are therefore not indicative of deflation fears—they are rather clear signs of a lack of confidence in future growth. I hasten to add that yields are low not because the Fed has made them so; they are low because the demand for Treasuries and safe cash equivalents is intense, and that demand, in turn, can only be driven by the market's strong preference for risk aversion. 

Chart #2

Chart #2 shows that new orders for capital goods—the seed corn of future productivity gains and a good barometer of business' confidence in the future—have rebounded strongly in recent months. This proxy for business investment is still relatively weak when viewed from an historical perspective (capex was much strong in previous economic expansions), but on the margin it has increased at an impressive pace of late. 

Chart #3

Chart #3 highlights the very strong increases in existing home sales in recent months. The housing market is on fire!

Chart #4

Chart #4 shows impressive strength as well in new home construction. Moreover, home builders have never been so optimistic about the future of residential construction. This foreshadows further impressive gains in housing starts and home sales in the months to come.

Chart #5

I don't normally pay much attention to the regional Fed manufacturing surveys, but as Chart #5 shows, conditions in the Richmond area are rather spectacular. Surely a V-shaped recovery of sorts.

Chart #6

Chart #6 shows a similar pattern—though not quite as strong—in the Dallas Fed manufacturing survey. Both Charts #5 and #6 contain data released yesterday and today. 

Chart #7

Chart #7 shows an index of non-energy industrial commodity prices. This also reflects a V-shaped recovery of impressive proportions, and it is driven not just by improving conditions in the U.S., but also in global economic activity. If nothing else, this is a good sign that there is no shortage of money in the world these days.

Chart #8

Third quarter GDP numbers will be released on Thursday, and the market is currently expecting a 32% annualized increase in real GDP. I've plotted that result in Chart #8. Even an impressive gain such as this is not enough, however, to erase the losses of the first half of the year. And compared to the long-term trend growth of real GDP (blue line), today's economy is about $4.5 trillion smaller than it otherwise might have been had we not had the slow-growth Obama recovery and the devastating Covid crisis. That translates into a "shortfall" of about 20%. Given our recent history of over a dozen years of sub-par growth mixed with two recessions, it's no wonder the market is having trouble getting optimistic about the future. 

I have not yet succumbed to pessimism, however. My hopes for the future are sustained by 1) the numerous and growing signs of a V-shaped recovery, 2) impressive progress in developing therapeutics and vaccines for Covid, 3) infection and case fatality rates for Covid that are coming in much lower than feared, 3) my enduring belief that the American public will invariably choose growth over redistributionist policies, and 4) the obvious signs of enthusiasm among Trump voters. 

Sunday, January 5, 2020

Federal debt is not a threat to the economy

Many people are saying that our national debt—which now exceeds $17 trillion and is growing by more than $1 trillion per year—is a disaster just waiting to happen. Right? Well, not exactly. Even though federal debt has soared relative to GDP in the past decade, the burden of the debt is about as low as it's ever been. Still, the growth in debt does reflect some structural problems that are working to keep the economy from achieving its full potential.

Let me put things into perspective:

Chart #1

Chart #1 shows the the swelling size of our national debt, which is correctly measured as the amount of Treasury debt that is held by the public, and that now stands at $17.16 trillion. Too often I see people saying the national debt is over $23 trillion, but that figure is inflated since it includes some $6 trillion which the government owes to itself (i.e., excess revenues that the social security administration has "lent" to the Treasury). You can see the current figures here.

Chart #1 uses a semi-log scale for the y-axis, so that means that a constant slope is equal to a constant rate of growth in nominal terms. Note that the slope of the line for the past 7-8 years has been flat (i.e., the growth rate has been constant). Note also that the slope was steeper in the mid-80s and in the 2008-2012 period. Federal debt is growing, but not nearly as fast as it was growing in other times.

Chart #2

It's common to hear people argue that with so much debt being issued, interest rates will inevitably have to rise. But as Chart #2 shows, the size of the debt (when measured relative to the size of the economy, which is essential, since a bigger economy can support a bigger debt load, just as households can with rising incomes) has tended to move in a very counterintuitive fashion with respect to interest rates. Slower growth in debt tends to coincide with rising interest rates, and faster growth in debt tends to coincide with falling interest rates. What explains this? It's tempting to search for an explanation for this relationship, and I make an attempt later in this post.

Chart #3

Nevertheless, the size of federal debt relative to the economy is far less important than the prevailing level of interest rates, as Chart #3 demonstrates. The true burden of the national debt is not the amount we owe but the ratio of interest payments on the debt relative to our national income (GDP). Because interest rates are at historically low levels, the current burden of our national debt is about as low as it has ever been, even though the debt has soared to 78% of GDP. 

Chart #4

It's worth noting that households' debt burdens (Chart #4) are also about as low as they have ever been. Everyone benefits from lower rates, but in addition, households have eschewed debt while embracing the safety of Treasuries. Total household liabilities have only increased by 11% since their peak in 2008, according to the Fed. Treasury yields are low because the demand for Treasuries is strong: households now hold over $2 trillion of federal debt, up hugely from $300 billion in 2008. Most of the rest is held by corporate and institutional investors, sovereigns, and foreign investors in general. China alone holds some $2 trillion of Treasury debt.

Chart #5

Chart #5 shows why we have come to have a $17 trillion debt. It's simple: government spending has exceeded revenues for just about forever. Note how revenues reliably weaken during recessions and pick up during recoveries. A stronger economy creates jobs, rising incomes, and rising tax payments. Tax receipts thus have a strong cyclical component. One reason for the apparent shortfall in revenues—which began at least a year before Trump's tax cuts—is that the past decade has seen the weakest growth of any expansion in history. 

Chart #6

Spending, on the other hand, is driven largely by transfer payments (medicare, medicaid, social security and income security), which now constitute about 70% of all federal spending (see Chart #6). In the 12 months ended last November, transfer payments totaled $3.2 trillion, while total federal spending totaled $4.5 trillion. No amount of budget cutting is going to make more than a modest dent to federal spending. The elephant in the spending living room is transfer payments, which are paid out according to people's "eligibility," and not according to any Congressional budget appropriations. To control spending will require that Congress change the eligibility formulas for things like social security and medicare. 

Chart #7

Chart #7 shows federal spending and revenues as a % of GDP. Here we see that the trends are relatively flat, and the current levels of spending and revenues are not greatly different from what they have averaged since WW II. Revenues do look a bit weak currently, but this is most likely due to the fact that economic growth in the current expansion has been sub-par (2.2% vs. a long-term average of about 3.1%). Revenues haven't picked up much in the current recovery because it has been a weak recovery and because tax rates were cut modestly for individuals and significantly for corporations in 2017. But tax cuts aren't the whole story: revenues weakened at least a year before Trump's tax cuts took effect, and in the past year revenues have been rising at more than a 4% rate. Corporate tax revenues plunged in 2017 and 2018, as expected, but in the first 11 months of 2019 they are up over 10% from the same period in 2018. The Trump tax cuts were a one-time event which was expected to result in much lower corporate revenues initially, to be followed by rising revenues in years to come as overseas profits are repatriated and increased business investment (of which there are few signs to date, unfortunately) results in rising profits in the future.

A digression on debt:

Broadly speaking, debt is a zero-sum game, since one man’s debt is another man’s asset. Debt is an agreement between two parties to exchange cash now with a reversal of that exchange, plus interest, in the future. If the borrower fails to repay his debt (i.e., he defaults), then the borrower benefits by being relieved of some or all of his debt service obligations, and the lender suffers by not receiving some or all of his expected cash flows. Part of the interest the lender charges the borrower goes to offset the risk of default. Most of the time, debt serves a vital economic function by linking savers with borrowers.

Ideally, the lender expects the borrower to use his money to fund a productive investment, such that the return on the investment will exceed the interest on the debt. If all the money loaned to borrowers is invested productively, everyone is happy—borrowers make money and lenders get repaid with interest. The problems with debt come not when people borrow money but when they use borrowed money to make unproductive investments or to simply finance consumption. (It's not the debt, it's the spending, stupid!) It's not clear at all whether using 70% of federal government borrowings to fund transfer payments is a wise use of borrowed money. Taking money from those who are working and giving it to those who are not working creates unproductive and anti-growth incentives. 

So it's not crazy to think that much of the federal government's debt has been used unproductively, and this is one reason why our economy's growth rate over the past decade has been sub-par. We've been squandering scarce resources (capital) and creating perverse anti-growth incentives. The potential size of this problem is staggering. In the past decade, after-tax corporate profits have totaled about $16.5 trillion, while federal debt has increased by about $9.4 trillion. In a sense, over half of the profits generated by corporate America have effectively been used to finance federal government spending. If the government hadn't borrowed all that money, it might have been used more efficiently by the private sector. Efficient investment, of course, boosts jobs, incomes, and overall prosperity. Inefficient investment leads to stagnation.

Meanwhile, slow growth has made people more cautious and that has increased the demand for money and people's demand for safety—thus the ready absorption of over $9 trillion of Treasury securities at very low interest rates. The Federal Reserve justifiably has accommodated the increased demand for money and safety by reducing interest rates. So in the current environment, slow growth and low interest rates go hand in hand, and the same conditions that drive low interest rates make lots of debt manageable. 

What will happen going forward? If the economy picks up steam, and if tariff wars begin to unwind (as appears to be the case), then money demand should decline, caution should recede, and interest rates should therefore rise. At the same time, a stronger economy would likely result in a further pickup in revenues, a smaller deficit, and slower growth in federal debt. So rising interest rates should go hand in hand with slower growth in total debt even as the burden of debt would tend to rise because of higher interest rates. This is not a recipe for disaster—it's a rosy scenario that we should dearly hope develops!

Chart #8

Meanwhile, nominal and real interest rates are unusually low, which means that the bond market does not yet expect to see accelerating economic growth. In fact, as Chart #8 suggests, the market seems priced to a further slowdown in growth; real interest rates on 5-yr TIPS moved into negative territory this week for the first time since April 2017. 

This market is not overly enthusiastic about the future, which gives me comfort that an optimistic approach to risk should be rewarded.

Things to watch for going forward; Real interest rates on TIPS are key barometers of the bond market's expectations for economic growth in the years ahead. If they rise this would be a good sign. Swap spreads are key indicators of the health of financial markets and leading indicators of economic health; right now they are very low and that is very good. Any rise above 30-35 bps on 2-yr swap spreads would be a flashing yellow light. Credit spreads on corporate debt are key indicators of the market's confidence in the outlook for corporate profits; currently they are relatively low and that is good. Commodity prices have been relatively low, but recently they show signs of perking up; if this continues that could be an indicator that the global economic outlook is improving. The residential construction has been in a period of consolidation in the past year or so, but recently appears to be picking up, and that is good. Any slowdown in the growth of bank savings deposits would be a good sign that risk aversion is declining and optimism is rising, and that would be very good. 

Looking ahead, I'm optimistic that the economy will continue to grow. I don't see a risk of recession nor do I see any significant acceleration. I'll be watching the aforementioned indicators to see if things improve enough to get really excited. 

Sunday, December 31, 2017

Predictions for 2018

One year ago I expected to see an improving economy and further gains in equity prices, and I sure got that right. Stocks are up big-time and GDP growth has accelerated somewhat. But I worried, as I have every year for the past 8 years, that the Fed might be slow to react to rising confidence and declining money demand, and that this could set off a bout of rising inflation. Fortunately, I got that wrong yet again, since inflation has remained in a comfortable 1.5 - 2% range. For the past two years I've liked emerging markets, and they have done quite well. Last year I didn't much care for gold or commodities, but they have done well thanks to a weaker dollar—which I didn't see coming. So it's a mixed bag for calls, but last year's 19.4% rise in equity prices goes a long way to making up for a few smaller losses. In any event, take the following with suitable grains of salt. I've been bullish and right (on stocks) for so long now that it makes even me nervous.

All throughout 2017 the world worried that Trump and the Republicans were going to prove incompetent. Was Trump crazy? Could he actually govern? Could the Republicans abolish Obamacare as promised? Could they pass tax reform? Turns out they did a pretty good, if far from perfect, job. Obamacare is being dismantled, beginning with the elimination of the mandate. Tax reform could have been better, but it achieved its main objective: to stimulate investment. Meanwhile, hidden behind the distractions of tweet storms and faux pas, Trump has accomplished a major reduction in federal regulatory burdens. This can really make a difference over the long haul, and it may already be contributing to faster growth.

Thinking back, Obama in his first year got a $1 trillion dollar stimulus package designed to boot-strap the economy by redistributing income (see my analysis here). The result was the slowest recovery on record; Obama ended up borrowing some $8 trillion to no avail, since nothing he did was aimed at increasing the market's desire to invest, work harder, or take risk. Trump in his first year got a $1.5 trillion (CBO-scored "cost") stimulus package designed to boost the economy by increasing the after-tax returns to business investment. I'm betting the results of Trump's tax reform will be much better than expected, but the market is not yet willing to make that same bet, and that is the point of departure for all predictions of what is to come.

If 2017 was about just one thing, it was the ability of the Republicans to pass meaningful tax reform. The market spent most of the year handicapping the odds of tax reform, and it would appear that it is now mostly, if not fully, priced in. The tax reform package boils down to a one-time 20% boost to after-tax corporate profits (by cutting the corporate income tax rate from 35% to 21%), and that's pretty much what we have seen happen to equity prices this past year.

If 2018 is going to be about just one thing, it will be whether boosting the after-tax rewards to business investment results in a stronger economy. Beginning in 2009, Obama and the Democrats gambled that a massive redistribution of income would boost demand and thus boost the economy, but they lost. They ended up flushing $8 trillion down the Keynesian toilet. Trump and the Republicans are now gambling that a significant increase in the after-tax rewards to business investment will boost the economy. Only time will tell, but there are already hints of a stronger economy in the data: e.g., capex is up, industrial production is up, business confidence and the ISM indices are up, and industrial metals prices are up. It's likely that the current quarter could mark the first time we've enjoyed three consecutive quarters of 3% or more growth in over 12 years.

I think the meme for 2018 will be this: waiting for GDP. If the economy shows convincing and durable signs of stronger growth, more investment, more jobs, and rising productivity, then the Republicans' gamble will have paid off. If not, the Democrats will have carte blanche to take control of Congress and oust a sitting president.

From my supply-sider's perspective, we now have the essential ingredients for a stronger economy in place. Tax incentives are correctly aligned to encourage more business investment; regulatory burdens are being slashed, business confidence is high, and the Fed is not a threat for the foreseeable future. Swap and credit spreads are low, as is implied volatility, and that tells us that liquidity is plentiful and systemic risk is low. The fact that the rest of the world is also doing better as well is just icing on the cake.

But, argue the skeptics, won't businesses just use their extra profits to buy back shares and increase their dividends, making the wealthy even wealthier without creating any new jobs? This oft-repeated allegation is an empty argument, because it ignores one key thing: what do those who receive the money from buybacks and dividends do with it? John Cochrane explains it in this brief excerpt (do read the whole thing):

Suppose company 1 gets a tax cut, doesn't really know what to do with the money -- on top of all the extra cash the company may already have -- as it doesn't have very good investment projects. It sends the money to shareholders. Well, what do shareholders do with it? (Hint: track the money.) They most likely roll the money in to other investments. They find company 2 that does need the money for investment, and send it to that company. In the end, they only consume it if nobody has any good investment ideas.
The larger economic point: In the end, investment in the whole economy has nothing to do with the financial decisions of individual companies. Investment will increase if the marginal, after-tax, return to investment increases. Lowering the corporate tax rate operates on that marginal incentive to new investments. It does not operate by "giving companies cash" which they may use, individually, to buy new forklifts, or to send to investors. Thinking about the cash, and not the marginal incentive, is a central mistake.

In other words, what some companies do with their extra cash is immaterial. What matters is that tax reform has increased the marginal incentive to invest—for the entire economy—by reducing tax rates and by allowing the immediate expensing of capex. On the margin, investment now has become more attractive and more profitable in the US, and this will almost certainly result in more investment (some of which is likely to come from overseas firms deciding to relocate here), which in turn means more jobs, more productivity, and higher real incomes. As I explained a few years ago, productivity has been the missing ingredient in the current lackluster recovery, and very weak business investment is one reason that productivity has gone missing. A pickup in investment is bound to raise productivity, which is the ultimate driver of growth and prosperity.

So it's clear to me that tax reform is a big deal, because it's very likely to boost the long-term growth trajectory of the US economy by a meaningful amount. Surprisingly, however, the market does not appear to share that view. Why else would real yields still be miserably low (e.g., 0.3% for 5-yr TIPS)? Why else would the market expect only a modest increase (0.75% or so) in the Fed's target funds rate for the foreseeable future? The current Fed target is 1.5%, while 2-yr Treasury yields, which are the market's expectation for what that rate will average over the next two years, are only 1.9%. As for real yields, the current Fed target translates into a real yield—using the PCE Core deflator—of roughly zero, while the yield on 5-yr TIPS says the market expects that rate to average only 0.3% over the next 5 years. If the economy really gets up a head of steam (e.g., real growth of 3% or more per year), I can't imagine the Fed wouldn't raise rates by more than the market currently expects, and I can't imagine nominal and real yields in general won't be significantly higher than they are today. The last time the economy was growing at 4% a year (early 2000s), 5-yr TIPS real yields were 3-4%.

Yet the Fed is the one thing I worry about, which is nothing new. The Fed has been responsible for every recession in recent memory, because each time they have tightened monetary policy in order to reduce inflation or to ward off an expected increase in inflation, they have ended up choking off growth. They are well aware of this, however, so they are going to be very careful about raising rates as the economy picks up steam. But as I've explained many times before, the Fed's worst nightmare is a return of confidence. More confidence in a time of surprisingly strong growth would almost certainly reduce the demand for money; if the Fed doesn't take offsetting moves to increase the demand for all those excess reserves in the banking system (e.g., by raising the funds rate target and draining bank reserves) the result would be an unwelcome rise in inflation. Inflation is a monetary phenomenon: when the supply of money exceeds the demand for it, inflation is the inevitable result. And higher inflation would set us up for the next recession.

On balance, I think it's quite likely the economy is going to improve, and surprisingly so. Ordinarily that would be great news for the equity market, since a stronger than expected economy should result in stronger than expected profits. But the market is still cautious, so good news is going to be met with increased skepticism: if the Fed raises rates as the economy improves, the market will worry that higher rates will increase the risk of recession. And even if the Fed is slow to raise rates, the market will see that as a sign that inflation is likely to move higher, and that would in turn increase the odds of more aggressive Fed tightening and eventually another recession. In short, we're probably going to see the market climb periodic walls of worry, just as it has for the past several years.

Risk assets should do well in this environment, given time, but there will be headwinds. Rising Treasury yields will act to keep PE ratios from rising further, so equity market gains are likely to be driven mainly by stronger-than-expected earnings. At the same  time, higher bond yields will make it easier to people to exit stocks (very low yields today make being short stocks very painful).

Emerging market economies are so far behind their developed counterparts that they have tremendous upside potential in a world that is increasingly prosperous, but a stronger than expected US economy is likely to boost the dollar, which in turn would put pressure on commodity markets and the emerging economies that depend on them.

I continue to believe that gold is trading at a significant premium to its long-term, inflation-adjusted price (which I estimate to be around $600/oz.) because the world is still risk-averse. So a stronger US economy and a stronger dollar would spell bad news for gold. Who needs gold if real yields and real growth are rising?

In order to judge whether things are playing out in a healthy fashion, it will be critical to periodically assess the status of the world's demand for money—particularly bank reserves, of which there are over $2 trillion in excess of what is needed for banks to collateralize their deposits. If banks' demand to hold excess reserves declines faster than the Fed's willingness to drain reserves and/or raise the interest rate it pays on reserves, then higher inflation is almost sure to rear its ugly head. Signs of that happening would likely be seen in rising inflation expectations, a falling dollar, a steeper yield curve, and/or rising gold and commodity prices.

The world is on the cusp of a new chapter of stronger growth, led by US tax reform. The US economy has plenty of upside potential, given the past 8 years of sub-par growth and a significant decline in the labor force participation rate and lingering risk aversion. Tax reform can and should unleash that underutilized potential and boost confidence. The future looks bright, but there are, of course, lots of things that could go wrong (e.g., North Korea, the Middle East, Trump's ego, the Fed) so if and as the world becomes less risk averse, an investor would be wise to remain cautious, since very few things these days are obviously cheap. On the other hand, Treasuries, and bond yields in general, look very low and should thus be approached with great caution.

Thursday, September 21, 2017

FOMC's cautious and correct plan to unwind QE

The bond market was little rattled yesterday after the FOMC announced that, despite the trauma of two major hurricanes, despite the absence of news suggesting the economy has strengthened, and despite the fact that inflation remains somewhat below their 2% target, they would proceed, starting next month, with the long-awaited unwinding of their Quantitative Easing efforts. This moderate surprise was somewhat offset by the FOMC's decision to hold off on hiking short-term interest rates, presumably until December. Now that the dust has settled, short-term interest rates are a handful of basis points higher, gold is down a bit, and the dollar is up a bit—all of which suggest a slight improvement in the market's outlook for the economy. People feel better knowing the Fed is finally on track to "normalize" its balance sheet, even though it will likely take several years to accomplish. (Their plan to start selling $6 billion per month of Treasuries and $4 billion per month of MBS, to be ramped up slowly, is very cautious and conservative and will take a long time.)

A review of some key market-based indicators shows that the market's outlook for economic growth is has only improved marginally from sub-par levels. More importantly, however, there are few if any signs in the market that the Fed's plans to raise short-term rates modestly, while slowly paring down the size of its monster bond portfolio, pose any threat to growth. This tells me that the Fed is moving in the right direction, and its caution is warranted. The Fed is proposing to move slowly and cautiously to take steps to bolster the demand for money (by raising the interest rate it pays on excess reserves), now that there are increasing signs that money demand is beginning to ebb. I reviewed this in detail in a post last month, "Something to worry about." As long as the Fed keeps the supply of money in line with the demand for money, we won't have to worry about inflation. So far, it looks like they have been doing their job, since inflation has been relatively low and stable for quite a few years, and forward-looking inflation expectations have not increased.


This first chart is one of the most important. Although neither the press nor the Fed normally talk about the inflation-adjusted Fed funds rate, that is the monetary variable which is the most important for the economy, since it sets the floor for the true cost of borrowing and the true benefit to saving. Today, the real rate of interest on overnight money is slightly negative (the funds rate is 1.25% and the inflation rate is about 1.5%). It's a lot less negative now than it has been for most of the current recovery, but it's still the case that although real borrowing costs are negative and real savings rates are very low or negative. This has been the case for years, and we have yet to see any unpleasant consequences. It can't go on forever, however. If the Fed holds the real funds rate to an unreasonably low level, that would inevitably result in an imbalance between the supply and demand for money, and that in turn would result in rising inflation, a weaker dollar, and rising gold and commodity prices.

The real yield on 5-yr TIPS is best thought of as the market's expectation for what the real Fed funds rate will average over the next 5 years. 5-yr TIPS today carry a real yield of only 0.1%, while the current real yield on the Fed funds rate is about -0.15% to -0.25%. That means the market expects only very modest "tightening" from the Fed over the next 5 years. This squares with implied forward rates which show the Fed raising rates only 2 or maybe 3 times over the next several years. Both the market and the Fed believe that interest rates need rise only modestly, and that in turn implies a belief that the economy will not pick up significantly from its 2% trend rate of growth that has prevailed since 2009.

As I've said many times before, one thing to watch for and worry about would be the nominal funds rate exceeding the 5-yr real TIPS yield. That would be the market's way of saying that the Fed is entering "tight" territory and thus threatening real economic growth.


The chart above is also very important. It shows that every recession in the past 60 years has been preceded by a substantial tightening of monetary policy. Monetary policy is tight when the real Fed funds rate (blue line) is at least 3-4%, and when the Treasury yield curve (red line) is flat or inverted. We are likely years away from seeing those conditions. 


As the chart above suggests, today's very low level of real interest rates is consistent with real GDP growth of about 2%. If the market today were convinced that major tax reform is going to happen in the foreseeable future, I have to believe that real interest rates would be significantly higher, because true tax reform could unleash a lot of the economy's untapped potential. So despite rumblings of progress on tax reform, the market has not priced it in yet. The market remains cautious, just as the Fed remains cautious.


The chart above shows how the bond market reveals its inflation expectations. The difference between the nominal yield on 5-yr Treasuries and the real yield on 5-yr TIPS gives us the market's expectations for what the CPI is going to average over the next 5 years. That's currently about 1.75%, which is very much in line with the current level of inflation (the CPI is up 1.9% in the past 12 months, and the Core CPI is up 1.7%). That tells me the market is reasonably confident that the Fed is going to be doing a good job for the foreseeable future. If the market were worried that the Fed was being too aggressive, inflation expectations would be declining.


The two charts above compare the price of gold to the price of 5-yr TIPS over different time frames. I find it fascinating that these two completely different assets should behave so similarly. If anything, it means that strong economic growth (which typically coincides with high real yields such as we had in the late 1990s) depresses demand for gold, and weak growth increases the demand for gold. That in turn suggests that buying gold today is a hedge against a weaker economy.


The two charts above show that credit spreads in the US are at relatively low levels ("normal" swap spreads are 15-30 bps or so). That implies that systemic risk is low, liquidity is plentiful, and the economy is unlikely to throw a wrench into the sales and profits of the US economy's businesses. Conditions are expected to be good, and profits are expected to rise. The Fed is years away from creating a liquidity squeeze, which could only be precipitated at this point by a massive reduction in bank reserves.


In the absence of obvious or budding threats to the economy, investors find it difficult to resist the stock market, which continues to drift higher. At the current PE ratio of the S&P 500 (21.5), stocks have an earnings yield of almost 4.7% (i.e., if companies paid out all their after tax profits in the form of dividends, the market's average dividend yield would be almost 4.7%). That yield beats the 4.3% yield on the average BAA corporate bond, and it towers over the 1 - 2.8% yields to be found in savings deposits and the Treasury market. Since stocks uniquely can be expected over time to produce capital gains in addition to their yield, the only reason the market would price stocks to yield more than bonds is that the market does not expect earnings to rise, and to more likely fall. Again, this is a sign of market caution.

But what is slowly happening is that the yield on stocks is declining as their prices rise, and the yield on cash is slowly rising as the price of money declines. This process could continue for some time to come, as the Fed sets the pace for the yield on cash and the market balances the expected risk-adjusted yield on equities with the risk-free returns on cash. It's a big balancing act that could be disrupted by unforeseen events, but for the time being it looks like everything is working out OK.

If something about this picture changes, I'd bet that it's the outlook for growth, which could improve if and when Congress manages to pass meaningful tax reform and privatize—at least to some extent—the healthcare industry. That would trigger reduced demand for money (since it would boost confidence and make risky investments more attractive), and that in turn would compel the Fed to accelerate rate hikes and the unwinding of QE. But even if all those good things came to pass, I would not expect to see the future returns on equities exceeding the returns we have seen in recent years. Stocks are no longer cheap and are instead arguably overvalued; dramatic grains from these levels are thus unlikely.