Showing posts sorted by relevance for query ppp. Sort by date Show all posts

Thursday, October 19, 2017

A Goldilocks dollar?

I've had a number of posts over the years that have looked at the value of the dollar vis a vis other currencies. One common thread in these posts has been a reference to each currency's Purchasing Power Parity (PPP), which in theory is the exchange rate which would make prices roughly comparable between two countries. Since the mid-1980s I've used the same methodology for estimating this value, and I've been continually impressed with how it's held up over time. Since I started this blog in late 2008, the dollar has been all over the map: plunging to its weakest level ever in 2011, then soaring over the subsequent five years to its late-2016 high. My PPP analysis says that today the dollar is pretty close to what could be called "fair value" against most of the major currencies, with the notable exception being the Australian dollar, which I estimate to be trading about 25% above my estimate of its PPP value vis a vis the dollar.

To calculate a currency's PPP value against the dollar, I first look for a period—a base year—when prices in that country were roughly comparable to prices in the US. I then adjust the value of the currency in the base year for the difference in inflation between that country and inflation in the US over time. If a country has lower inflation than the US, its PPP value will rise over time, and if a country has more inflation than the US, its PPP value will decline. I should add that I've had occasion to visit each country over the years, and have been able to validate my PPP estimate by subjectively comparing how prices for food, clothing, hotels, etc. compare to US prices (there's an element of judgment at work here, but I think most observers would agree that my estimate of PPP is not too far off—comments pro and con are welcome). As you can see in the charts below, a currency rarely trades at or near its PPP. Instead, most currencies tend to cycle up and down relative to their PPP value, becoming alternately strong and then weak. One important caveat: although divergences between a country's PPP rate and its actual exchange rate tend to close and even reverse over time, PPP should not be used to bet on a currency's future strength or weakness, since it can take years for conditions to change. This is not a trading tool, it's a way to judge how strong or weak a currency is at any one time.


I begin with the Fed's calculation of the dollar's inflation-adjusted value vis a vis a trade-weighted basket of currencies. This is arguably the single best measure of the dollar's overall strength or weakness. The blue line measures the dollar against a basket of more than 100 currencies, while the purple line compares it to a basket of about a dozen currencies. Against a broad basket of currencies the dollar is today is roughly equal to its average since 1973. Relative to the largest currencies, the dollar is about 5-10% above its long-term average. Call it a Goldilocks dollar: neither too strong nor too weak.


The chart above shows how the Euro has tracked its PPP over time. The Euro began in 1997, but I extended its value back in time using the DM as a proxy. Note that the Euro's PPP has trended upwards against the dollar over many decades, a reflection of the fact that Europe has had less inflation than the US. Today the Euro is trading at almost exactly my estimate for its PPP. US visitors to Europe should find that prices there are pretty similar to prices here. Similarly, European visitors to the US should not be surprised to find things cost about the same here as in Europe.


As the first chart above shows, Japan has had a lot less inflation than the US since the late 1970s, and the yen has been very strong throughout most of that period. Some would say the Bank of Japan has been too tight, keeping inflation too low and the yen to strong, and that in turn has curtailed economic growth by making Japanese exports expensive, among other things. In any event, the yen is no longer too strong. As the second chart shows, the yen may now be at a level that is allowing the economy to pick up. Note that the stock market has surged in the past year or so, even as the yen has strengthened a bit.


As the chart above shows, the UK has experienced a lot more inflation than the US in the past several decades; as a result the Pound has been in a long-term, declining trend vis a vis the dollar. Currently the Pound is trading very close to my estimate of PPP. Traveling to the UK in the mid-2000s, as I did frequently, was a painful experience since prices were very expensive. Today it's a much nicer experience.


As the first chart above shows, Canada's inflation has been very similar to US inflation for the past 30 years. However, the Canadian dollar has been all over the map—very weak in the early 2000s, and extremely strong in the late 2000s. The strength or weakness of the Canadian dollar has tended to be the mirror opposite of the dollar's strength or weakness, and both have been highly correlated—until recently—with commodity prices, as the second chart above shows. (Canada positively correlated, the US dollar negatively correlated)


Finally, we come to the Australian dollar, which by my calculations is trading about 25% above its PPP value vis a vis the dollar. Australia continues to benefit from strong commodity prices and from strong demand from China. But the loonie is no longer egregiously strong, as it was some 5 years ago.

At current levels, exchange rates paint a picture of a global economy that is rough equilibrium. No country, with the possible exception of Australia and a few others—is judged by the market to be inherently more attractive than others, on a risk-adjusted basis, and thus worthy of a relatively strong currency. Currency risk has ebbed, as a result, and this may contribute to a continuation of global growth (less risk tends to favor investment, which in turn is the engine of growth). Altogether, not a bad state of affairs.

Tuesday, January 24, 2012

Dollar review: still very weak

By almost any measure, the U.S. dollar is at or near its weakest levels ever, whether nominally or in real terms. This is in part a reflection of the fact that U.S. inflation has tended to be higher than that of other countries, but perhaps more importantly, it shows that the market's outlook for and confidence in the U.S. economy is dismal.


This first chart is the most common measure of the dollar's value (DXY) as compared to a relatively small, trade-weighted basket of six major currencies (EUR, JPY, GBP, CAD, SEK, CHF). The dollar is bouncing along the bottom, today about 10% above its all-time low, and it has lost 50% of what it was worth at its peak in 1985.


This next chart is arguably the best measure of the dollar's value against other currencies. Calculated by the Fed, it shows the dollar's value on a trade-weighted and inflation-adjusted basis against a very broad basket of currencies (over 100), and against a smaller basket of major currencies. Again we see that today the dollar is only marginally above it's all-time lows and has lost one-third of its all-time high value in 1985, when the economy was booming and the Fed had conquered double-digit inflation. Since early 2002 it has lost 25% of its purchasing power against other currencies.


The chart above shows the dollar vs. the yen (blue line), and my calculation of the dollar's Purchasing Power Parity exchange rate against the yen. The idea of PPP is to start with a base value of an exchange rate, preferably chosen from a time when trade and capital flows were in rough balance and inflation differentials were minimal, and then adjust that value for inflation differentials. If country A has less inflation than country B, then country A's PPP exchange rate will rise against B's currency, as it must in order to keep prices equal in the two economies. (In all the charts here, an upward sloping line means that U.S. inflation has on balance between greater than the inflation rate of each individual country.) If a currency trades above its PPP, then it can be considered "overvalued" relative to the dollar, since prices in that country will be higher than in the other country, and a currency trading below its PPP is consequently undervalued relative to the dollar.

If a PPP calculation is done correctly (caution: it's more art than science), then if a currency tracks its PPP over time, tourists from each country traveling in the other should find that prices are roughly the same as what they pay at home for similar goods and services. In the case of Europe, my calculation of PPP suggests that prices in Europe today are roughly 13% higher than prices in the U.S. In other words, the Euro is about 13% overvalued against the dollar.


As this next chart shows, Japan has experienced significantly less inflation than the U.S. since the late 1970s, and that is reflected in the sharply upward-sloping PPP line for the yen. Not surprisingly, the yen has appreciated tremendously against the dollar since 1970 (100 yen buys 4.6 times more dollars today than it did then), as purchasing power parity theory would predict. By my calculations, the yen currently is about 50% overvalued against the dollar, meaning that for a U.S. tourist, traveling in Japan is very expensive.


In contrast to the ever-appreciating yen, the long-term trend of the the pound vis a vis the dollar has been down, as this next chart shows, because U.K. inflation has been higher than U.S. inflation. I was unfortunate to have my youngest daughter studying in London some 5 years ago, when the pound was at its strongest level ever relative to dollar. Today, prices in the U.K. are still more expensive than in the U.S., but not by much—only about 17% by my calculations.


The Canadian dollar today is almost as strong relative to the U.S. dollar as it has ever been, and on a par with the strength of the yen. What a contrast from its weakest level, back in 2002! With Canadian inflation being very similar to U.S. inflation over the past two decades, I doubt that the loonie is going to appreciate further. Canada likely has benefited as much as it ever will from the global commodity price boom. With the loonie trading at close to parity to the dollar, Canadians are finding U.S. prices irresistibly cheap, and on the margin this could put upward pressure on U.S. prices and downward pressure on Canadian prices. For that matter, tourists from almost all parts of the world are finding that U.S. vacations are cheap thanks to the weak dollar.


The story in Australia is very similar to the one in Canada. Like Canada, Australia's economy is heavily influenced by its bounty of natural resources, and commodity prices today are still very near their all-time highs. The commodity boom has been great for the Australian economy, and by extension great for the Aussie dollar. But given the current degree of overvaluation (over 50%), I doubt the Aussie dollar has much upside left. 


I haven't calculated the PPP value of the Chinese yuan, but this chart shows the real value of the yuan relative to a basket of currencies on an inflation-adjusted basis, as calculated by the BIS. What it shows is that since pegging its currency to the dollar at the beginning of 1994, the yuan has appreciated 68% in real terms against the currencies of its trading partners. That puts the yuan right up there with the yen in the ranks of strong and appreciating currencies in recent decades. Over this same 18 year period, the dollar (DXY) index has fallen 16%, and the Real Broad Dollar Index has dropped 6%, so the yuan has unmistakably appreciated in every sense, and significantly, against not only the dollar but against most other currencies. Protectionists in the U.S. should stop complaining about the supposed "unfair advantage" that a supposedly cheap yuan confers on Chinese exports. And anyway, if the Chinese want to sell us cheap stuff, why should we complain? Cheap Chinese goods only hurt a small segment of our economy (i.e., those few that have to compete with Chinese imports, which comprise less than 3% of what U.S. consumers spend every year), but they greatly benefit everyone else. And of course, the strong yuan is the flip side of a weak dollar. Why would we want to cheapen the dollar, since that can only make imported goods more expensive for everyone?


The dollar is worth only marginally less relative to gold than ever before. If the price of gold says anything about a currency's value, the 10-yr surge in gold prices is a gigantic vote of no confidence in the dollar, and an implicit bet by the market that the dollar will lose even more of its value against other things and other currencies in the future.


Non-energy, raw industrial commodity prices are only 16% off their all-time highs, but way above their average in the 1980s and 1990s. This also reflects poorly on the dollar's purchasing power, and it is no coincidence that the rise in gold and commodity prices started at almost the same time as the dollar's decline (relative to other currencies) from its early 2002 highs. Gold and commodity prices act like canaries in the monetary gold mine, warning of dollar debasement.


Crude oil prices are about one-third less than their 2008 highs, but orders of magnitude higher than they were 10 years ago, which not coincidentally was the latest high-water mark for the dollar. It's worth remembering that crude oil, commodity, and gold prices all began soaring very soon after Nixon decided to break the dollar's tie to gold in the early 1970s.


Real estate stands out as one of the very few tangible assets that are not even close to an all-time high. Commercial real estate, for example, is worth about the same today as it was when the dollar reached its peak in early 2002, and residential real estate, according to the Case Shiller property index, is worth only 15% more (though the cost of financing real estate is at an all-time low). In other words, the dollar is worth a lot more relative to real estate than it is relative to other currencies and commodities. That in turn suggests that real estate is the cheapest hedge against further dollar weakness.


Finally, corporate profits aren't worth very much in terms of dollars. Considering that PE ratios are 17% below their long-term average and the dollar is very close to its all-time lows, U.S. equities are practically on a fire sale in the eyes of foreign investors. A dollar of earnings has almost never been so cheap for the rest of the world, yet after-tax corporate profits today are at all-time highs, both nominally and relative to GDP. This has only one meaning: the market has almost no faith that the outlook for the U.S. economy will be anything but dismal. This reflects poorly on our monetary policy, which has the potential to greatly increase future inflation, and on our fiscal policy, since trillion-dollar-plus annual deficits and massive unfunded entitlement liabilities have the potential to significantly increase future tax burdens.

All of the above adds up to a very depressing message: the market thinks the U.S. sucks. However, it also confirms my repeated assertions that valuations are still extremely depressed. Conditions are terrible, even grim, but lots of bad news is priced into just about everything. If U.S. monetary and fiscal policy can move even modestly in a more positive/less negative direction in coming years, there is plenty of upside for equity prices.

Monday, August 30, 2010

Putting the yen into perspective


"Japan Battles Soaring Yen," is the title of the front-page feature article in today's WSJ. The yen recently strengthened to 84 versus the dollar, the strongest level seen since the yen briefly flirted with 80 back in April '95. The yen has been the strongest currency in the world over the past 40 years, rising from just under 400 yen to the dollar in the early 1970s, to 85 today.


The inherent strength of the yen is also seen in this second chart, which shows the value of gold in dollars, euros, and yen. Since 1977, gold has risen about seven-fold in dollar terms, about five-fold in euro terms (linking the euro to the DM), and only two and a half-fold in yen terms. The yen's long-term strength is not so much due to some mysterious force, as it is due to Japan's central bank. Japan's currency is strongest relative to gold and other currencies because the Bank of Japan has done a much better job of keeping inflation low than any other central bank.

But currency strength is best measured in inflation-adjusted terms, not in nominal terms, and that's the point of the first and third charts. The blue line in the first chart is the nominal value of the yen/dollar exchange rate, while the green line is my calculation of the purchasing power parity (PPP) value of the exchange rate. The PPP value is the level of the exchange rate over time that would make prices in Japan roughly similar to corresponding prices in the U.S. This line is driven by changes in the relative inflation rate between the two currencies. Japan's PPP has been rising relative to the U.S. dollar ever since the late 1970s because Japan's inflation rate has been much lower than ours. In fact, Japan's CPI has risen only half as much as our CPI since early 1977. This inflation differential would dictate that the dollar should have lost about half its value against the yen, and that is reflected in the appreciation of the dollar/yen PPP exchange rate from 240 to 120.

The degree of a currency's strength can be measured by comparing its current value to its PPP value. On that basis, in the mid 1990s the yen was far stronger relative to the dollar than it is today, as seen in this last chart. By my calculations, the yen today is only about 40% "overvalued" vis a vis the dollar, which means that a U.S. tourist today should expect to find that things in Japan cost on average about 40% more than they do in the U.S.


According to the headlines, the yen is incredibly strong relative to the dollar. But when you look at relative inflation differentials, the yen today is not much stronger, on average, than it has been since the mid-1980s.

Friday, May 14, 2010

Currency update


The dollar has been in the limelight of late, benefiting from the euro's Greek travails, but as the last chart shows, the dollar in general is still pretty weak compared to where it's been in the past. And since gold is rising against all currencies, it makes more sense to say that the euro is weaker on the margin than the dollar, than to say the dollar is strong. The dollar is rising on the margin relative to a lot of currencies because the news here is somewhat better than the market had feared (i.e., less bad than expected), while the news overseas is either not continuing to improve or is underperforming optimistic expectations, particularly in Europe with the looming restructuring of Greek debt and the ECB apparently willing to monetize some debt to provide relief to struggling debtors.

The euro is still somewhat strong relative to its purchasing power parity vis a vis the dollar, but clearly weakening. The market is pricing in the increased likelihood that the political pressures for a Greek bailout will compromise the ECB's ability to run a tight monetary policy. The bearish euro trade likely has some room to room, because it would have to fall a lot more before it became cheap.

The currencies that are fundamentally strong these days, on a purchasing power basis (according to my calculations of PPP as shown on the charts), are the emerging market and commodity currencies. The Australian and Canadian dollars are about as strong relative to the dollar (on a purchasing power basis) as they've ever been, and ditto for the Brazilian real. But they do seem to be pushing their limits. When a currency is stretched relative to its PPP, the news has to continue to be awfully good (or awfully bad, as the case may be), in order to sustain those valuation extremes. So that means AUD and CAD are very vulnerable to any signs of a) weaker growth, b) tighter monetary policy in the developed world, or c) weaker commodity prices. Being long these currencies at these levels requires courageous conviction.

The yen is also fundamentally strong, but primarily because the Bank of Japan continues to pursue a very tight monetary policy—note that the steep upward slope of the PPP line reflects over three decades during which inflation in Japan has been significantly lower than in the U.S. The yen has a lot of tight money momentum going for it, but most of that is being counteracted by a persistently weak economy. Plus, at these levels it is clearly overvalued relative to its PPP and thus vulnerable to any bad news or just news that isn't completely supportive.

I've been moderately bullish on the dollar since last December (check my forecasts near year-end),  but I am losing my enthusiasm as the dollar climbs. The Fed continues to insist it will remain super-easy for the foreseeable future, and that is a clear negative. At the same time I think the world is overdoing its concerns about the demise of the euro. The euro currency area is a bit larger than the U.S. economy; you don't just walk away from the euro because one relatively small country is having problems. Imagine telling the 300 million people in the U.S. that you're going to change from the dollar to the Can-dol-peso; the logistics alone, not to mention the political fury that would be unleashed, are mind-boggling. Europe has made its currency bed and it is going to have to sleep in it. At some point the majority of Europe is just going to have to ignore the Greek protests. And the Greeks are just going to have to trim their bloated government, and that won't be an unbearable task. For heaven's sake, all this government spending is a huge problem, so getting rid of it should be a huge relief.

Monday, March 4, 2013

Sterling update: still somewhat expensive

Last Friday I suggested that the dollar was still very weak against a large basket of currencies. This post focuses on the dollar's value vis a vis the British Pound.


The green line in the above chart is my calculation of the Purchasing Power Parity of the dollar/sterling exchange rate. This is the rate that in theory would make prices equal between the two countries. At this rate U.S. tourists to the U.K. would find that on average goods and services cost about the same there as in the states. The rate is calculated by using a base year for the exchange rate (i.e., a period during which prices where roughly equivalent between the two countries) and adjusting that rate by the difference in inflation over time between the U.S. and the U.K. The PPP of the pound has been falling over the entire period of the chart, which means that inflation in the U.K. has been higher than inflation in the U.S. So the PPP value of the pound must fall in order for prices to remain equal (i.e., the weaker PPP value of the pound offsets the higher nominal prices in the U.K.).

As a rule of thumb, significant deviations between the value of a currency relative to its PPP value reflect stronger/weaker demand for the currency, which in turn is related to confidence in a country's fiscal and monetary policies, and/or the outlook for the economy.

Currently, I estimate that the pound is about 10-15% overvalued relative to the dollar. If I'm right, that means that goods and services cost about 10-15% more in the U.K. than they do in the U.S. This is down significantly from the 40% overvaluation of the pound in late 2007. The dollar was weak against almost all currencies back then, and it had been falling for the previous 5 years. The Euro was also quite strong at the time, and Eurozone equities had outperformed U.S. equities for 5 years running. As I see it, the world was much more optimistic about the future of Europe at the time than about the future of the U.S. Today the world is losing its enthusiasm for Europe as the list of things to worry about (relatively high public debt/GDP ratios, relatively high tax rates, large unfunded pension liabilities, sovereign debt defaults, a potential breakup of the ECU, the inability of most states to cut back on excessive public sector spending) lengthens. Meanwhile, things haven't been as bad in the U.S. as had been expected.

If the U.K.'s troubles prove to be deep-seated, intractable, and worse than the troubles still plaguing the U.S., then the pound is likely to fall further against the dollar. In a worst-case scenario, there is little reason why the pound couldn't again approach parity with the dollar, as it almost did in 1985. For the time being, I'd be reluctant to be long the pound vis a vis the dollar. U.S. investors would be wise to ensure that any investments they have in Europe or the U.K. are not exposed to currency risk. U.K. investors might want to leave the currency exposure of any U.S. investments unhedged.

Monday, September 22, 2014

The return of King Dollar

The U.S. dollar has made some impressive gains of late, brightening the outlook in general with the hope that economic and political fundamentals continue to improve in the years to come. I've borrowed the title of this post from my good friends Larry Kudlow and Steve Moore, and I think this post makes a nice complement to their recent column in National Review Online.


Against a trade-weighted basket of major currencies, the U.S. dollar has risen over 15% from its all-time low of three years ago, and over one-third of that increase has come in the past three months (see chart above).


It's been an impressive rally of late, but as the chart above shows, from a long-term perspective the dollar is still relatively weak, whether measured against a trade-weighted, inflation-adjusted basket of major currencies or against a similar basket of more than 100 currencies (see chart above). Relative to its all-time high of May, 1985, when the economy was booming and the Fed was fighting inflation with sky-high interest rates, the dollar today is almost 30% weaker. Relative to the early 2000s, when the economy and equity markets were booming and the Fed was fighting the specter of rising inflation, the dollar today is about 20% weaker.

The following charts focus on the dollar's strength and weakness relative to five major currencies, by comparing their current (spot) value to my calculation of their Purchasing Power Parity value. PPP theory holds that, over time, currencies move vis a vis others in a way that reflects changes in relative prices between between countries. Currencies that depreciate against others typically have higher inflation rates, and currencies that appreciate have lower inflation. For each currency I've picked a base year in which I thought that prices were in rough equilibrium, then adjusted that value over time for changes in relative inflation rates. The current PPP value of each currency is therefore approximately equal to the exchange rate that would produce roughly equal prices for a given basket of goods and services in each country.


By my calculations, the current PPP value of the Euro vis a vis the dollar is about 1.16 dollars per Euro. Since the Euro is currently trading at 1.29, that implies that a U.S. tourist visiting the Eurozone today would find that goods and services there cost about 10% more than in the U.S. on average (1.29/1.16 = 1.11).


As for Sterling, my calculations suggest that goods and services in the U.K. today cost about 25% more than they do in the U.S. In other words, the pound is about 25% "overvalued" relative to the dollar. The fact that the green line has been sloping down for the past several years tells us that U.K. inflation has been higher than U.S. inflation, and that over time the pound is therefore likely to fall relative to the dollar, all other things being equal.


The yen has experienced a rather dramatic weakening over the past three years, falling from a high of 75 to almost 109, for a loss of over 30% against the dollar. Big currency losses like this are rarely good news, but in this case the big drop in the yen has coincided with huge gains in the Japanese equity market, as the second of the above charts shows. I think that's because the yen had been so strong for so long against almost every currency on the planet that it had created deflationary pressures which were suffocating the economy. The yen's relentless appreciation over the previous 40 years made life very difficult for Japanese industry, for example, since they had to continually cut their costs to remain competitive with overseas manufactures. Now that the yen is closing in on its PPP value relative to the dollar, and the Abe administration is pursuing more growth-oriented fiscal policies, it's become very good news for the Japanese economy and for the world.


As the first of the above two charts shows, big changes in the dollar's value tend to go hand in hand with big (and inverse) changes in the prices of commodities. Commodities peaked in 2011 about the same time the dollar hit its all-time low; a rising dollar since then has coincided with a return of weaker commodity prices. Since the Australian economy is heavily dependent on commodity exports, the Aussie dollar has tended to move with commodity prices. It too peaked against the dollar in 2011, and since then it has dropped almost 20% relative to the U.S. dollar. By my calculations, the Aussie dollar is still about 40% "overvalued" against the U.S. dollar, making Australia a rather expensive vacation destination for U.S. tourists. (And by the same logic, the U.S. offers very inexpensive vacations for Australian tourists.)


The story is quite similar for the Canadian dollar, since Canada is also dependent on commodities, although not as much as Australia. I figure the loonie is still almost 20% "overvalued" against the U.S. dollar. As the chart above shows, Canadian inflation has been almost identical to U.S. inflation over the past 20 years, which makes it likely that eventually the loonie will weaken further against the dollar.

Why was the dollar so weak three years ago? The list of possible causes is long, but I think the important ones are 1) fears that the Fed's QE efforts would debase the dollar and lead to higher inflation; 2) fears that trillion-dollar federal budget deficits would prove to be the norm and that in turn would lead to a significant rise in U.S. tax burdens; and 3) fears that an onerous increase in regulatory burdens under Obamacare and Dodd-Frank would weigh on the economy; and 4) fears that the U.S. economy was vulnerable to a double-dip recession.

We've still got lots of problems to deal with (and the dollar is still weak), but we now know that the Fed hasn't (yet) made a big inflation mistake, and is on the verge of ending QE and beginning to normalize short-term interest rates. We also know that the federal budget deficit has fallen by two-thirds and is currently quite manageable. Moreover, the debate over entitlement spending, which holds the key to the long-run budget outlook, is now centered around when and by how much spending can be cut, not whether. The ongoing failure of Obamacare and the long list of bureaucratic scandals in recent years have convinced a majority of the people that we suffer from too much, not too little government. Too much government killed Greece, and it's killing Venezuela and Argentina as we speak. Finally, the U.S economy has managed to grow by a relatively steady 2% pace for the past five years, and has been able to grow despite pronounced weakness in the Eurozone and a significant slowdown in the Chinese economy.

In short, things have turned out much better than the market feared.


Looking ahead, it's now pretty clear that the Fed is going to pursue tighter monetary policy than the ECB, the BoE, and the BoJ. Interest rate differentials are moving in favor of the dollar (i.e., U.S. short-term rates are rising relative to overseas rates) in anticipation of this, and that has also helped boost the dollar, as the chart above shows.

So even though the U.S. economy is saddled with a very uncompetitive tax system, a hugely burdensome regulatory environment, and an abysmally low labor force participation rate, it's doing better than most other countries.

In short, things haven't turned out nearly as bad as the market feared.

Investment implications. With the outlook improving on the margin and the dollar rising on the margin, U.S. investments look attractive relative to non dollar investments. Commodity prices are likely to weaken further if the dollar continues to strengthen. This is unlikely to be bad news for emerging market economies, however, because the dollar will be strengthening, and interest rates will be rising, as the outlook for the U.S. economy improves. A stronger dollar that results from overt and aggressive Fed tightening can be very bad news for emerging markets, since it presages a sharp slowdown in the U.S. economy—that was the case in the early 2000s. Every recession in the past 50 years has followed a period of very tight monetary policy, as evidenced by high real interest rates and a flat or inverted yield curve. We're years away from that.

As the PPP charts above suggest, the currencies with the most to lose potentially against the dollar are the Aussie dollar, the Canadian dollar, and Sterling.


A stronger dollar would most likely lead to weaker commodity prices, especially so in the case of gold. As the chart above suggests, gold prices "overshot" commodity prices in the wild and wooly days following the near-collapse of global financial markets during the depths of the Great Recession, and the onset of the Fed's unprecedented expansion of its balance sheet. Fortunately, the world has emerged intact, the dollar has not been debased, and inflation remains low. Without a great deal of fear to sustain it, gold prices are unlikely to sustain their still-lofty levels. In the absence of any new fears, gold is likely to converge back down to commodity prices.

I'm pleased to note that in my predictions for 2014 I correctly thought that the dollar would strengthen this year, and that gold and commodities were unattractive investments. (Check out my other predictions, most of which still appear to be correct.)

Friday, January 29, 2010

Australian dollar update


I post this to follow up on a question from a reader concerning the advisability of investing in Australia. The main risk I see is that everyone loves Australia right now, and that's why the currency is about as strong relative to the U.S. dollar as it has ever been. If you are a U.S. investor putting money to work in Australia today, the price of admission is very high. That's not to say the investment doesn't make sense, just that the relative value of the investment is not terribly attractive, and there is the potential for significant downside currency risk.

To explain the chart: the blue line is simply the Aussie dollar exchange rate, while the green line is what I calculate the purchasing power parity (PPP) of the exchange rate to be over time. The PPP calculation takes account of the differential in inflation between Australia and the U.S., and it is theoretically the value of the currency that would make a given basket of goods and services cost the same in both countries. With the blue line exceeding the green line by a wide margin, this means that a U.S. visitor to Australia is likely to find that most things are expensive relative to what they cost in the U.S.

The downtrend evident in the PPP line means that Australian inflation has tended to be higher than U.S. inflation, so the currency therefore has a tendency to trend lower over time against the dollar. This may of course change in the future, and that wouldn't be impossible at all, especially considering that the Aussie central bank has already tightened monetary policy but the Fed is many months away from doing so.

Friday, December 31, 2010

Year-end review of the dollar: very weak

As the year winds down and we survey what's done well and what hasn't, the dollar stands out as not having done much on balance. It's down against the yen, up against the euro, down against the loonie, down against the aussie, and up against the pound. It's about unchanged against a basket of major currencies, weaker against a large basket of currencies, and weaker against the Indian and Chinese currencies. On an inflation-adjusted basis, against a very large basket of trade-weighted currencies, the dollar is weaker on the year. From a long-term perspective, the dollar stands out as very weak, and by one measure (arguably the best) it is now as weak as it's ever been.


This is perhaps the most popular measure of the dollar's value, and it compares the dollar to the Euro, Yen, Pound, Canadian Dollar, Swedish Krona, and Swiss Franc on a trade-weighted basis. The dollar by this measure is up 1.5% for the year, but that is small consolation given how weak it remains.


This second chart compares the dollar to a very large basket of currencies on a trade-weighted basis. Pretty much the same story as the first chart: the dollar is very weak.


The third chart (arguably the best measure of the dollar's overall value against other currencies, and my personal favorite) compares the dollar to a very large basket of trade-weighted currencies, and is adjusted for inflation differentials. This corrects for those situations where high-inflation currencies fall by a lot against the dollar in nominal terms; if not corrected for inflation differentials, the effective decline in those currencies is exaggerated, and thus the dollar comes out looking stronger than it really is. This index shows the dollar has—for the fourth time since 1973—hit an all-time low.


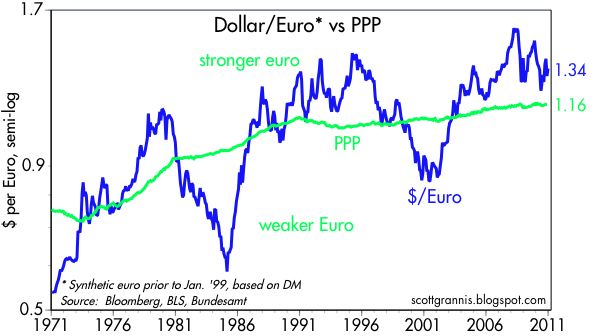
This next chart (above) shows the dollar vs. the euro, using a synthetic value of the euro (based on the DM) for the years prior to 1999. In this and in the charts that follow, the green line is my estimate of the purchasing power parity (PPP) of the dollar—the exchange rate that would equate prices between the two countries. This value changes according to relative inflation differentials. In the case of the euro, the PPP value of the euro has been trending stronger since the 1970s because inflation in Europe has for the most part been lower than inflation in the U.S. According to this chart, at today's value of 1.34 dollars per euro, the euro is about 15% "overvalued" against the dollar. That is a way of saying that a U.S. citizen traveling in Europe is likely to find that, on average, things cost about 15% more in Europe than they do in the U.S. Note that the dollar has been much weaker against the euro than it is today, and the reason for this is that the euro is suffering from fears that sovereign defaults among its member nations (e.g., Ireland, Portugal, Spain, and Italy) could result in a breakup of the euro. Personally, I think that is a very unlikely event, but in the meantime the perceived threat to the euro ends up being to the advantage of the dollar.


This chart (above) shows the dramatic gain in the value of the Canadian dollar vs. the US dollar. Relative to its PPP, the loonie today is almost as strong as it has ever been. US tourists are likely to find that traveling in Canada is quite expensive these days. Strong commodity prices have helped support the loonie, as has its central bank. Monetary policy in Canada has been less volatile than in the U.S., and Canada has apparently avoided a housing and bank bust.


The Australian dollar (above) has also benefited enormously from strong commodity prices, which in turn have boosted its resource-based economy, with the result that it is now about 50% "overvalued" relative to the dollar by my calculations.

The yen today is trading right around its strongest level ever (in nominal terms) against the dollar. But in inflation-adjusted terms, the yen is not as strong today as it was in 1995, when it was briefly "overvalued" against the dollar by almost 100%. By my calculations, today the yen is about 50% "overvalued" against the dollar. The long-term strengthening of the yen against the dollar is explained by the fact that Japan has had much lower inflation than the U.S., and that in turn is the result of Japan's chronically tight—to the point of being somewhat deflationary—monetary policy.


The pound at $1.56 is only about 12% "overvalued" by my calculations, and it has weakened considerably in recent years. (I was unlucky to have my daughter studying in London during the years when the pound was the strongest.) The long-term trend of the pound against the dollar has been down, and that is explained by the fact that inflation in the U.K. has been consistently higher than in the U.S.

I note that all of these major currencies are "overvalued" relative to the U.S. to some degree. That's the flip side of saying that the dollar is "undervalued" against all these currencies, and that confirms the message in the first set of charts above, which is that the dollar is generally very weak.


This last chart compares the dollar (blue line, inverted) against one measure of commodity prices. Note how the correlation between the two has been fairly strong in the past decade—dollar weakness corresponds to commodity strength, and vice versa. This is one way of showing that there is a monetary explanation for rising commodity prices: a weaker dollar buys less of other currencies and fewer commodities. Dollar weakness, in turn, is ultimately the responsibility of the Fed: keeping interest rates too low results in an effective over-supply of dollars, and a loss of the dollar's purchasing power.

Bottom line: the dollar is unequivocally weak against many objective standards (e.g., gold, commodities, and other currencies). It's about as weak, in fact, as it has ever been, and its prospects are grim, since the Fed has vowed to remain ultra-accommodative for a long time to come. If there is a silver lining to this dark dollar cloud, it is that with the dollar at extremely weak levels, perhaps all the bad news is priced in. If so, then the dollar becomes quite "vulnerable" to any good news, or simply to a failure of the expected bad news to show up. I'm on record as predicting the dollar will strengthen against most major currencies this coming year, and I sure hope I'm right, since further dollar weakness from this point would be very unpleasant, if not inflationary.