


This is a short post to update M2, GDP, and inflation statistics. All are consistent with the view that the economy is growing at a moderate pace and inflation is fast approaching the Fed's target (indeed, by some measures it is already below target).
M2, the most important monetary variable that the world (and the Fed) seem resolutely to ignore, continues to decline. It ballooned in 2020 and 2021 as $6 trillion in deficit-financed COVID "stimulus" spending was mysteriously monetized. Since then, excess M2 has dropped by more than half, and the remainder has been effectively neutralized by Fed interest rate hikes.
In apparent defiance of multiple forecasts that Fed tightening would surely result in a 2023 dominated by recession, GDP grew at a recently-revised and robust 5.2% annualized rate in the third quarter. Once again, market wisdom (e.g., the economy has the unique ability to confound the majority of forecasts) has proven correct. Those who still adhere to Phillips Curve thinking are still scratching their heads: how is it that the economy can strengthen even as the Fed tightens and inflation falls?
It is now abundantly clear that the Fed has no reason to tighten monetary conditions any further. Inflation is within spitting distance of its target. Indeed, the only question at this point is When will they begin to ease? The market is now quite sure that the first easing will come at the May '24 FOMC meeting, but there is no reason they can't ease well before then. Thus, there is reason to remain optimistic about the outlook for the economy and the financial markets.
Chart #1

Chart #1 shows the level of the M2 measure of the money supply, arguably the best measure of money that is easily spendable. Since 1995, M2 grew by about 6% per year, all the while inflation remained relatively low and stable. The "bulge" in M2 has now shrunk by more than half, thanks to negative M2 growth and ongoing growth in prices and the size of the economy.
Chart #2
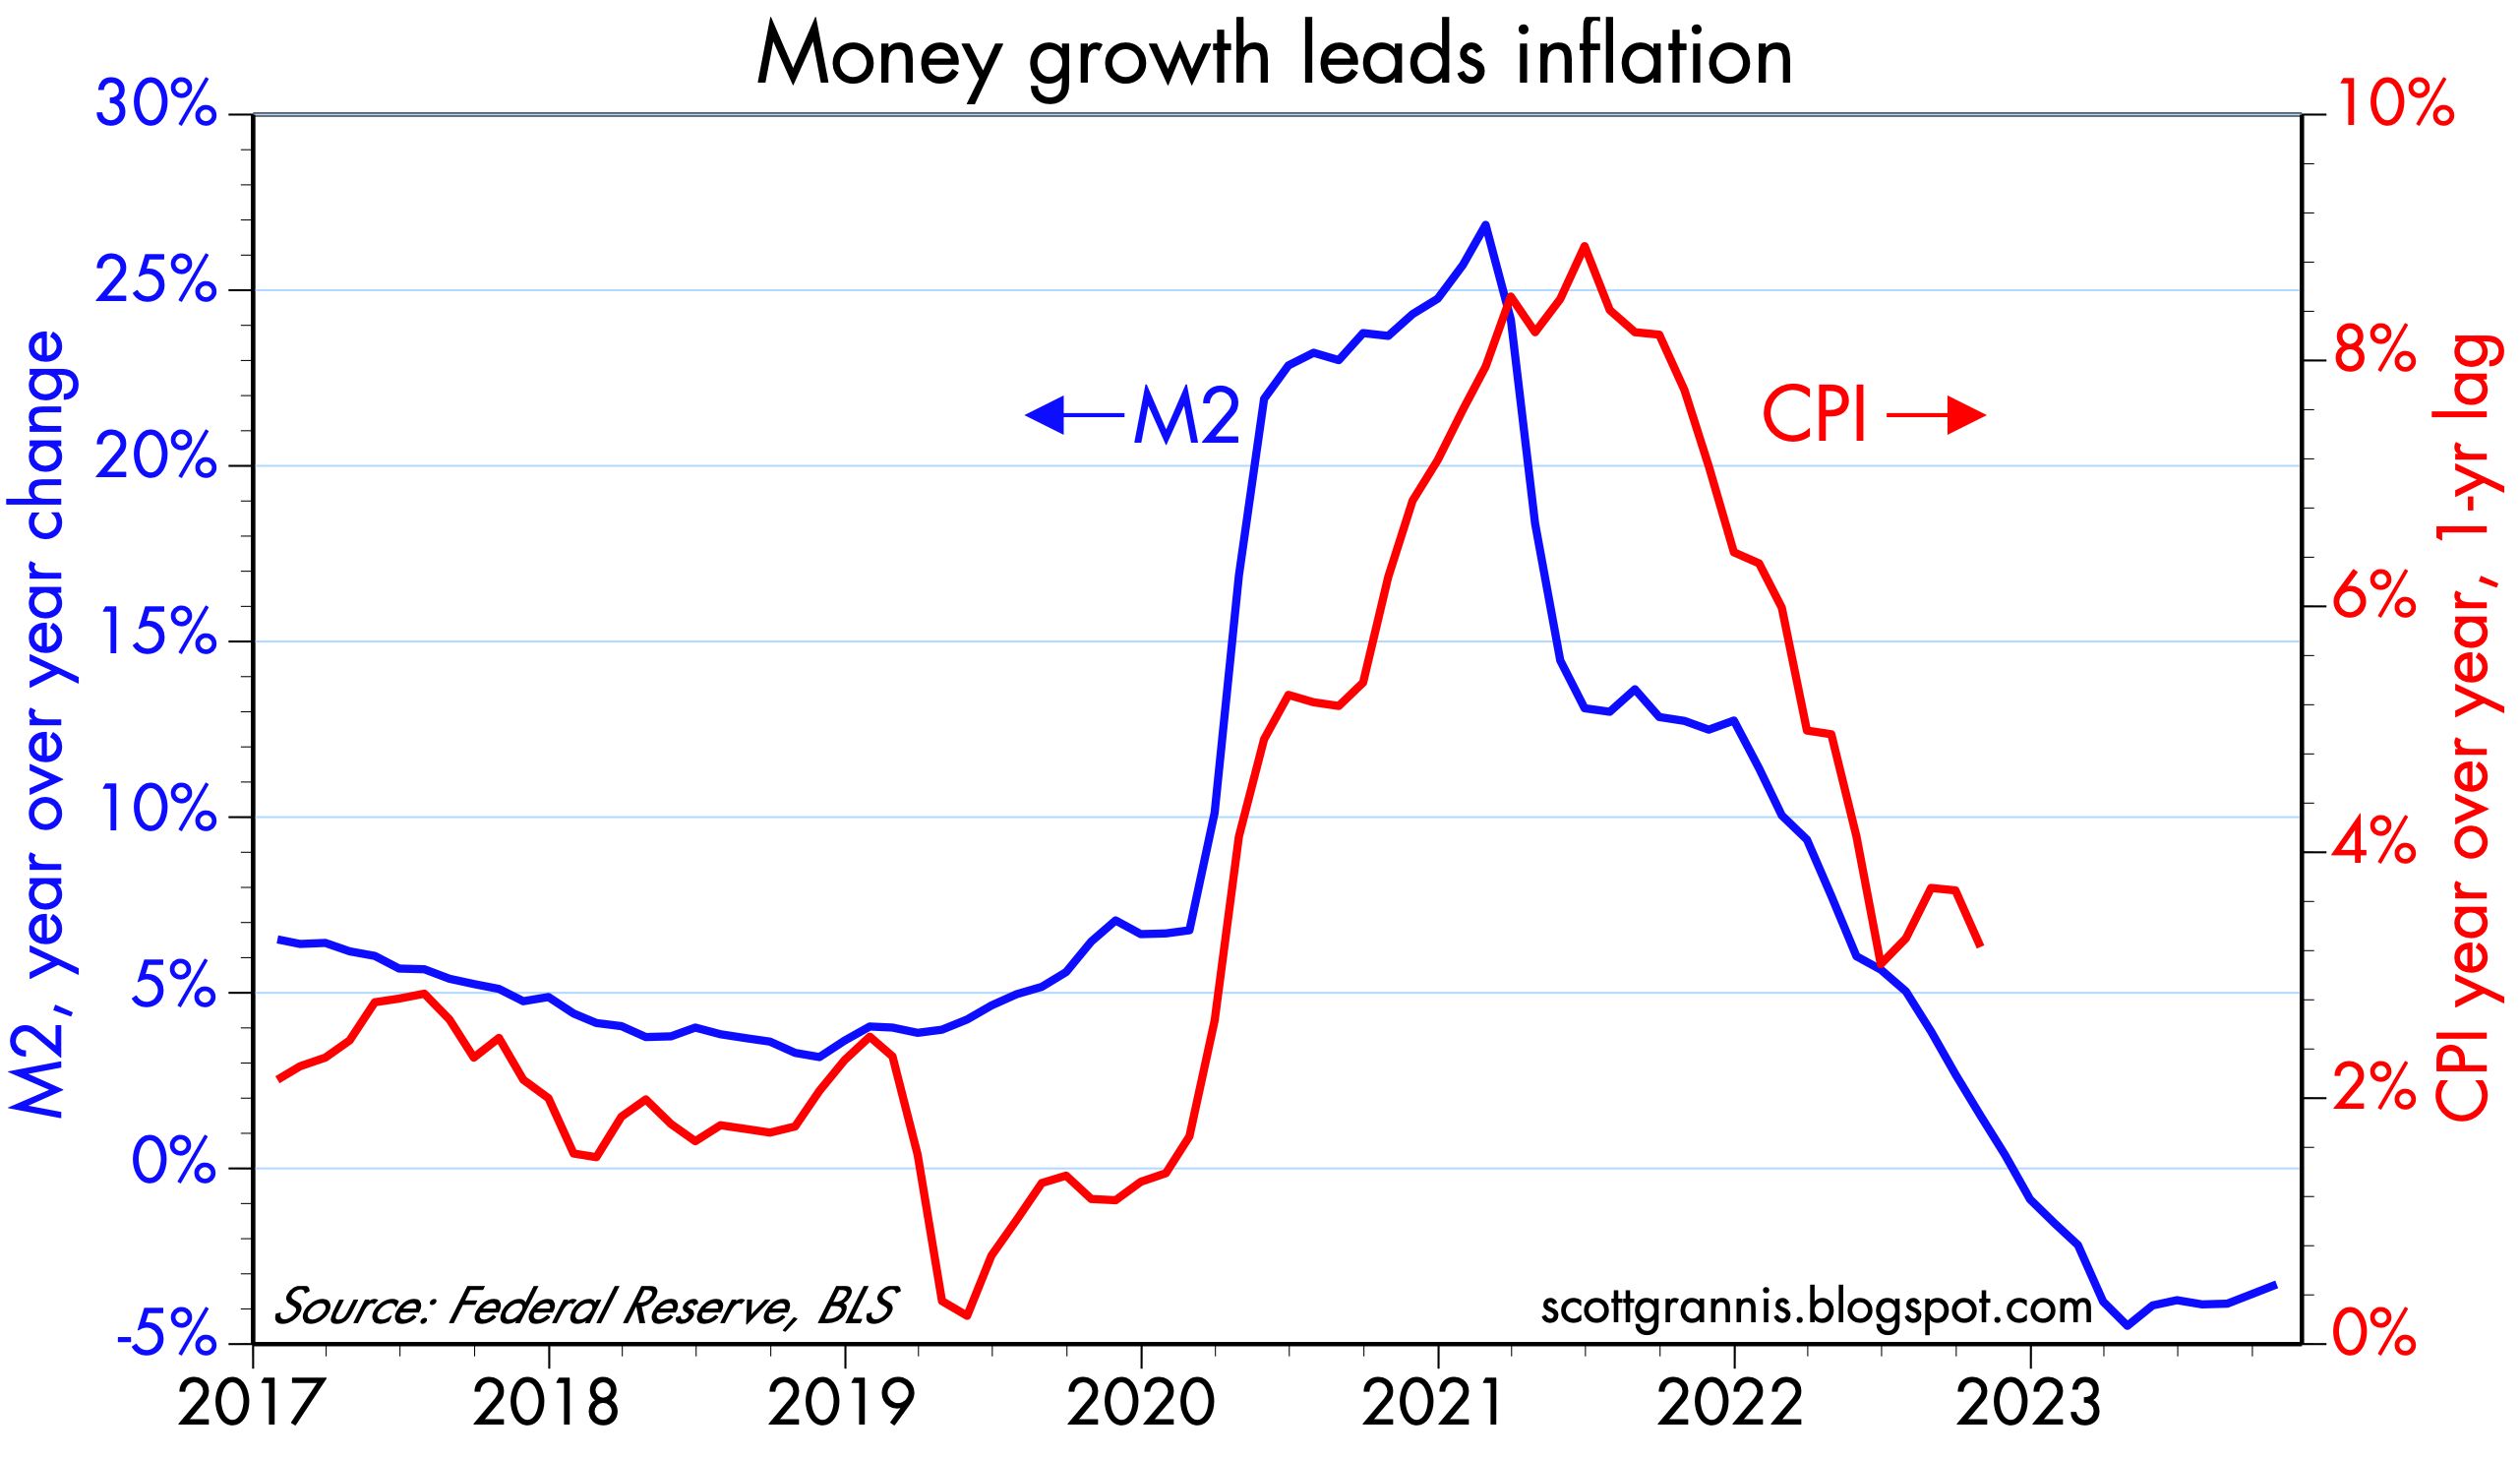
Chart #2 is designed to show how growth in M2 predicts inflation by about one year. Negative M2 growth since late 2022 strongly suggests that measured inflation will be declining for the next year.
Chart #3
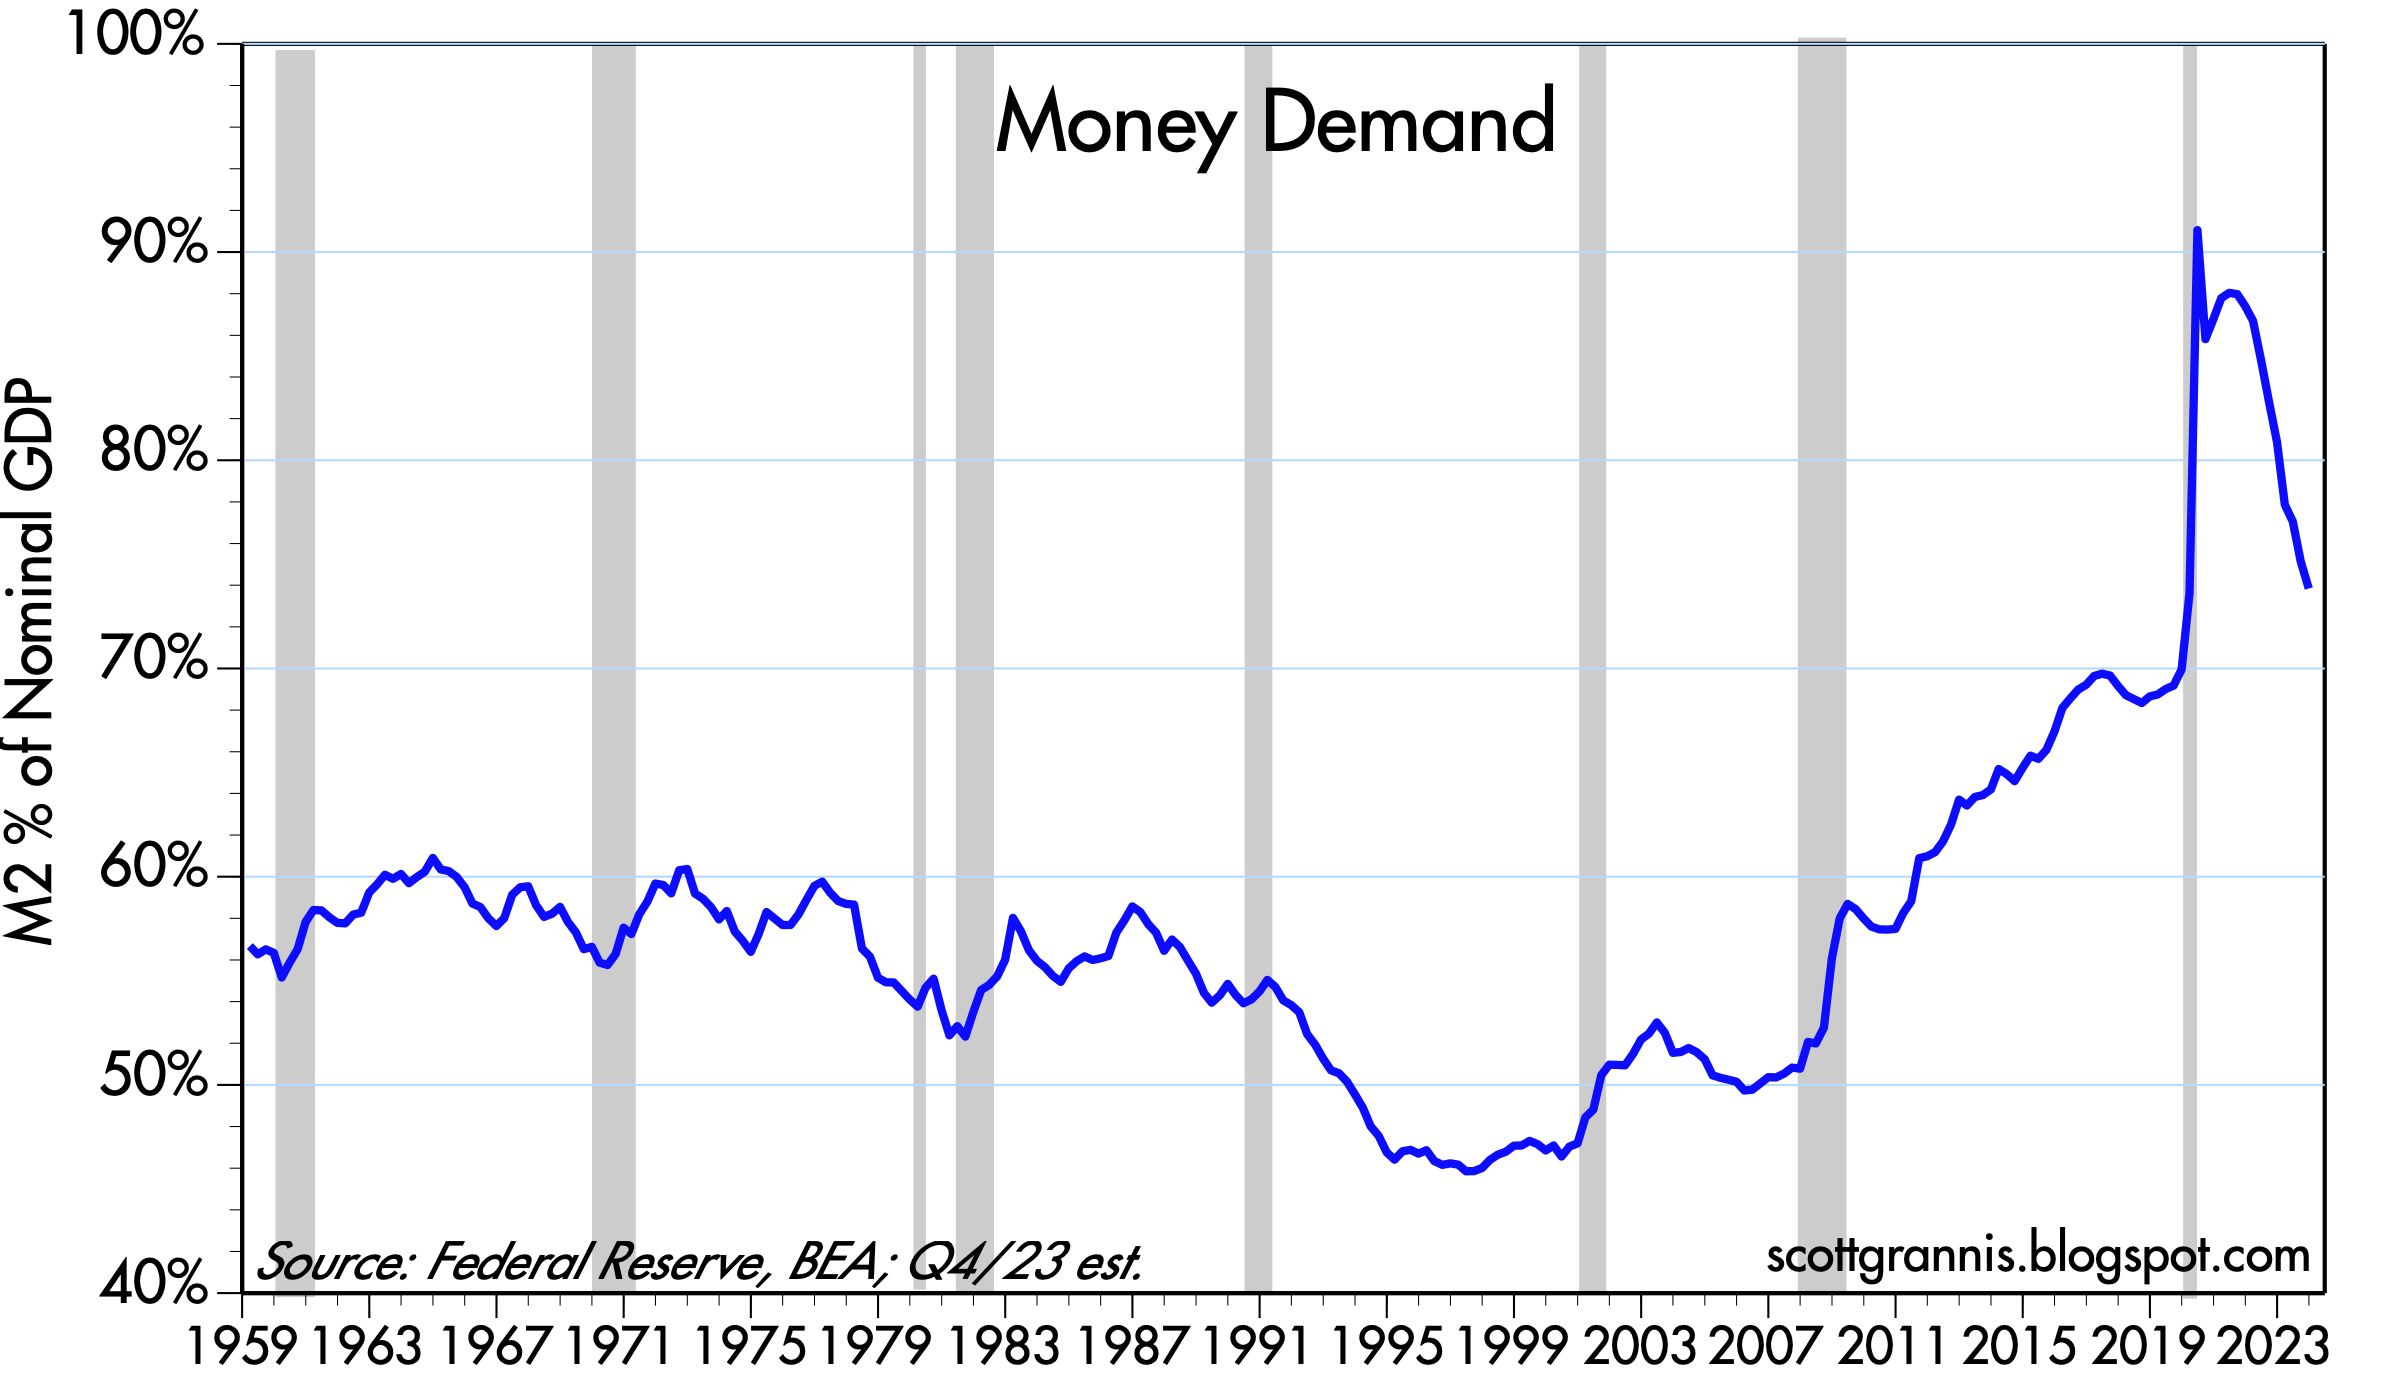
Chart #3 looks at what I call "Money Demand." It's the ratio of M2 to nominal GDP, and it is best described as the amount of readily-spendable cash money that households are willing to hold expressed as a percentage of their annual income. Money demand surged during the onset of the Covid crisis, only to then collapse as the world slowly returned to normal. In times of crisis it is natural for folks to want to hold bigger money balances, and to subsequently spend down those balances as the crisis passes. Money demand today is almost back to where it was pre-Covid by this measure. Today, folks are still willing to hold some extra cash thanks to the fact that interest rates on cash have soared. Short-term interest rates of 5% or so actually more than make up for current inflation rates of 3% or so. So there's an incentive to hold on to cash rather than spend it. For most of the past 3-4 years or so, those incentives were reversed: interest rates were lower than inflation, so the smart thing to do was to "borrow and buy." Today the monetary incentives are tilted to "save and invest."
Chart #4

The inflation drama is over.
8 comments:
Are you familiar with Kartik Gada's theories regarding inflation/deflation?
Thanks Scott!
russ: not familiar with him. Can you share a link that includes his theories?
Scott, You've written many times about the trailing 6% growth trend of M2 and it seems as though you think that growth rate is okay. I have one simple question; do you think that trend of 6% M2 growth per year is sustainable going forward?
It seems to me that if the Fed raises rates before the midpoint of 2024's house-buying season, property prices and housing will explode again, and then inflation becomes an issue again. Short of deteriorating fundamentals, it seems to me they should hold until later next year.
"if the Fed raises rates before the midpoint of 2024's house-buying season, property prices and housing will explode again, and then inflation becomes an issue again"
It seems like the Fed (and the Federal Govt via its spending), have to thread a needle. Too loose and RE goes to stratospheric high prices/no affordability; too tight and the interest on the govt. debt blows up.
We probably need a recession. A mild one would do the trick.
wkeinw,
There is no reason for the Fed to raise rates in the next 6 months. Inflation is declining.
Oops, I meant "If the Fed *lowers* rates before mid-2024, housing prices will keep moving higher". A little late for me to re-ask, but I just wonder whether the Fed wants housing prices to re-accelerate next year. Someone correct me if they think I'm wrong, but it seems to me that holding rates elevated until well after buying season starts might allow the Fed to cut rates, while avoiding at least some of the eventual increased inflation that home-price rises will bring.
Post a Comment