


My reason for being bullish on bonds (i.e., expecting lower interest rates) is based my observation that inflation will continue to decline. I'm optimistic the economy will avoid a recession because I see low and falling swap and credit spreads, which in turn are indicative of a healthy outlook for the economy and corporate profits.
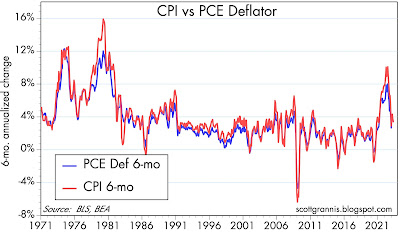
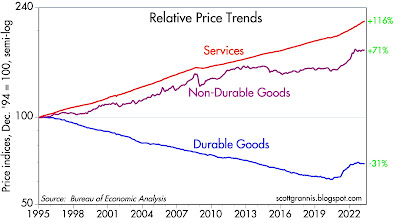
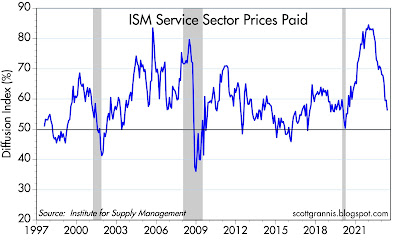


Chart #1

Year over year measures of inflation fail to pick up turning points until after the fact. That's why I prefer to use a 6-mo. annualized measure of inflation, which I've used in Chart #1. Both the Personal Consumption Expenditure Deflator and the CPI have fallen to below 4% by this measure (CPI 3.3%, PCE deflator 3.5%), and are within striking distance of the Fed's 2% target.
Chart #2

Chart #2 shows the relative behavior of the three main components of the PCE deflator. The striking news here is that durable and non-durable goods prices have not changed at all since last June! The only prices that have been rising in the past 10 months are services prices; and shelter prices (rents and housing prices) make up a large portion of services prices.
Chart #3

As for the rest of the service sector, the May ISM survey (Chart #3) shows that only a small majority of service sector firms report paying higher prices. That's lower that the historical average for this survey, which is 60%. That's relatively recent data which confirms that inflation pressures continue to fall for this very important segment of the economy.
Chart #4

Chart #4 shows how changes in housing prices take about 18 months to show up in the CPI, through what is called Owner's Equivalent Rent, which in turn comprises about one-third of the CPI. Since housing prices have how been falling for the past 18 months, the OER component of the CPI will become negative in coming months, thus subtracting a major portion of upward inflation pressure in the CPI.
Chart #5

Not surprisingly, the bond market has figured this out. The green line is the market's expectation for what the CPI will average over the next 5 years: 2.15%. If you convert this to the PCE deflator, that's roughly equivalent to a forecast that the PCE deflator will average 1.7% or so over the next 5 years—and that's less than the Fed's target of 2%. Does the Fed pay any attention to the bond market? I sure wish they would.
Chart #6

Chart #6 shows Credit Default Swap spreads, which are a highly liquid proxy for corporate credit spreads, which in turn are indicators of the market's confidence in the outlook for corporate profits—and by extension for the outlook for the health of the economy. CDS spreads are relatively low and have been falling since the Silicon Valley Bank fiasco. This is very comforting.
Chart #7

Chart #7 shows a broader and somewhat less liquid measure of corporate bond spreads. By this measure too, spreads are relatively low and have been falling in recent months.
Chart #8

Chart #8 shows 2-year swap spreads, which are excellent and very liquid indicators of market liquidity and the outlook for the economy. Here too we see that conditions in the US have been improving of late and are generally quite healthy. Even conditions in Europe have improved of late. At current levels, 2-yr swaps in the US are in the lower portion of what a "normal" range would be. I think this is highly important, since it shows that the Fed's tightening actions have not resulted in a loss of liquidity in the bond market, and that in turn is essential to healthy, functioning markets. The Fed has raised rates by enough to balance the demand for money with the supply of money, and that is all it takes to bring inflation down. There is no need for the Fed to intentionally weaken the economy in order to fight inflation. (Higher rates make you more inclined to hold on to your cash, since it can be invested at a decent rate, contrary to the conditions that prevailed early last year, when short-term interest rates were close to zero.
All things considered, the economy should avoid a recession, inflation should continue to decline, and sooner or later the Fed will be lowering short-term interest rates.
29 comments:
Your post about a "2% world" is where the "confusion" comes from. For what it's worth, I think it might be closer to a 1% world.
So, a bunch of the economic indicators, e.g. for recession, will be currently triggered based on history. Several decades ago, when it was much closer to a 3% or 4% world, the economy was sloping rapidly down (or up) when it was near 1% or 2% growth. Now it's stagnated around there (when operating "normally"), so the indicators are very mixed.
Market indicators I watch are not bearish. In late 2020 the commodity markets were appreciating, and by late winter 2022, the financial markets were giving bearish signals. In fall 2022, bullish financial market signals started flashing. They are currently mildly bullish/mixed.
Thanks for the post.
From a Jamin Ball blog. Any concerns?
Above I described how decreasing the balance in the TGA (drawing it down) can increase liquidity in markets. The opposite is true - increasing the balance of the TGA can DECREASE liquidity in markets. Especially when we see a massive increase in issuance to refill the TGA like we will se over the remainder of the year. How does this happen? Banks use their reserves to buy the newly issued T Bills. As their reserves go down, they have less firepower to lend out (and the lower reserves put upward pressure on rates).
So what does this mean? We may be entering a period of QT plus a liquidity DRAIN from refilling the TGA. While we were more recently in QT, it was at least partially offset by liquidity coming from drawing down the TGA. That offset is going away…
This topic is very nuanced. There are ways where selling bills to refill the TGA actually has a net neutral effect on liquidity (the Fed can manage this). It depends on who buyers are (bank vs non-bank institutions, domestic vs international, etc), the timing of the government spending that follows the capital raise, and many other factors. I’ve read smart people take opposing viewpoints on this. Some argue the impending treasury bill sales will greatly drain liquidity, others argue there will be a net neutral effect (currently $2.2T of money market fund cash sitting in reverse repo at the Fed which can be used to offset bill sales)
Coming up with a point of view on whether the bill sales will have a net negative or neutral effect on liquidity goes past the depth of my own knowledge. I won’t pretend to be an expert on the topic. I do believe regardless that there will be more headwinds to liquidity leaving markets in the weeks / months ahead. I believe bill sales start today (Monday).
My goal here is to lay out the situation we find ourselves in today, with some higher level context. Hopefully it’s helpful! I’m very open to constructive criticism on what I got wrong, or others viewpoints on what happens with liquidity throughout the balance of the year. I’m learning on the fly as well
Great comment on the effects of replenishing the TGA. I don't understand the dynamics but wonder if the money comes out of Money Market funds or the banking system. I guess it will depend on the yields compared to what the MMFs can get in other Fed vehicles. Could be a liquidity storm for risky assets the next few months but hope not
All the FED has to do is adjust the award rate for the O/N RRP facility.
What bonds are you bullish on? TLT?
There are two storm clouds, no longer small and no longer on the horizon, that have the potential at some indeterminate future date to "wash" the U.S. and the Foreign-dollar "down the drain". They go by the name of "foreign trade deficit" and "domestic federal deficit".
These twin deficits have an insidious, if not an incestuous, relationship. Positive interest rate differentials are significantly responsible for the dollar's exchange rate support. And an "overvalued" dollar in turn is the principal contributor to our burgeoning trade deficits.
The viability of the U.S. and Foreign-dollar as international units of account is threatened by the huge trade deficits. Given the present and prospective trade deficits, this situation is not likely to continue for long. Foreigners will simply be saturated with excess dollars.
The volume of dollar-denominated liquid assets held by foreigners is extremely large. Any significant repatriation of these funds, by reducing the supply of loan-funds, will force interest rates up - thus increasing the federal deficit and the burden of all new debt.
These events alone could trigger a downswing in the economy resulting in more unemployment, more unemployment compensation, less tax revenues and larger federal deficits. Truly a vicious cycle.
We are almost 3 years into a tightening cycle and now Canada joins the US in trying to be "extra vigilant". Chinese numbers are coming out nearly deflationary, and that would seem a great deal more important than the data from our neighbor to the north.
People still walk around with masks, even though the pandemic is past and every study showed masking was irrelevant in preventing the disease transmission. Another example of preparing for a danger past.
Clay
The Fed is also looking at the CORE PCE deflator, which hasn't declined much at all and remains smartly over 4%.
Thank you, Scott.
I have to admit I have been expecting a slowdown for a while now; it sure is challenging to overcome the emotional bias once your mind is set. Your data-based posts and common sense arguments are of great help in achieving this...
The o/n rrp award rate is lower than money market rates (rates < 1 year). An increase in t-bills should keep short-term rates higher than the award rate. Thus, funds will come out of the O/N RRP to meet demand.
Money demand is still high, M2/GDP.
M2/Gross Domestic Product | FRED | St. Louis Fed (stlouisfed.org)
Shadowstats: "The most-liquid “Basic M1” (currency plus Demand Deposits) held 118.1% above its Pre-Pandemic Level and is increasing year-to-year," I.e., velocity is increasing.
But the proxy for R-gDp is decreasing. It could become negative in the 2nd qtr. of 2023. I.e., M is being offset by an increase in Vt.
As Dr. Milton Friedman posited; From Carol A. Ledenham’s Hoover Institution archives: “I would make reserve requirements the same for time and demand deposits”. Dec. 16, 1959.
Link: Fiscal Dominance and the Return of Zero-Interest Bank Reserve Requirements (stlouisfed.org)
“imposing high reserve requirements for zero-interest paying reserves may seem quite attractive to a policymaker interested in reducing the inflationary consequences of fiscal dominance.”
Hello,
Can anyone please explain to me what the economic purpose is of the Reverse Repo facility?
I can understand the Repo facility (not Reverse), i.e. that banks/funds need overnight liquidity and come to the Fed to sell their Treasuries, but why in the world would the Fed ever need to raise liquidity overnight (selling same Treasuries)?
Even if it did, why would it even need to create this facility when it can always just sell its Treasuries for Bank Reserves?
Why indeed! The FED's Ph.Ds. have learned their catechisms, that there is no difference between money and liquid assets. The FED's monetary transmission mechanism is interest rate manipulation. The O/N RRP facility establishes a "floor". Otherwise, there'd be negative nominal interest rates. There is too much liquidity in the economy. The O/N RRP facility sterilizes some funds.
Economists don't know a debit from a credit:
https://www.zerohedge.com/markets/fed-fkery-continues-massive-non-seasonal-bank-deposit-inflow
The NBFIs are the DFI's customers.
Link: Primer: A Deposit’s Life
https://fedguy.com/primer-a-deposits-life/
The economy is being run in reverse. The payment of interest on interbank demand deposits suppresses interest rates. It forces investors to rebalance. It stokes asset prices, housing, stocks, etc. It causes income inequality, lower standard of livings, and a rentier economy. It’s Marxism.
Banks don’t lend deposits. Ergo, bank-held savings are impounded (increases the demand for money). You get higher real rates of interest for saver-holders by driving the banks out of the savings business, by activating monetary savings (and simultaneously tightening bank credit). This doesn’t reduce the size of the payment’s system and it makes the banking system more profitable.
That was the reason for Section 11 of the Banking Act of 1933, Regulation Q.
Link Richard Werner:
Prof. Werner brilliantly explains how the banking system and financial sector really work. – YouTube
This is the GOSPEL
In 1931 a commission was established on Member Bank Reserve Requirements. The commission completed their recommendations after a 7-year inquiry on Feb. 5, 1938. The study was entitled “Member Bank Reserve Requirements — Analysis of Committee Proposal”
its 2nd proposal: “Requirements against debits to deposits”
After a 45 year hiatus, this research paper was “declassified” on March 23, 1983. By the time this paper was “declassified”, Nobel Laureate Dr. Milton Friedman had declared RRs to be a “tax” [sic].
Monetarism has never been tried.
re: " why would it even need to create this facility when it can always just sell its Treasuries for Bank Reserves?"
That's what the trading desk should do. But it would destabilize the FED's overnight interest rate pegs. The time horizon of the trading desk’s policy has been 24 hours rather than 24 months.
“We’ve come a long way in policy tightening and the stance of policy is restrictive and we face UNCERTAINTY about the lagged effects of our tightening so far and about the extent of credit tightening from recent banking stresses,” Powell told a Fed conference Friday in Washington.
The effect of the FED’s operations on interest rates (now largely via the remuneration rate), is indirect, varies widely over time, and in magnitude. What the net expansion of money will be, as a consequence of a given injection of additional reserves, nobody knows until long after the fact.
The consequence is a delayed, remote, and approximate control over the lending and money-creating capacity of the payment’s system.
This is the GOSPEL
http://bit.ly/1A9bYH1
Interest is the price of credit. The price of money is the reciprocal of the price level. The money stock can never be properly managed by any attempt to control the cost of credit.
As I said: The only tool, credit control device, at the disposal of the monetary authority in a free capitalistic system through which the volume of money can be properly controlled is legal reserves. The FED will obviously, sometime in the future, lose control of the money stock.
May 8, 2020. 10:38 AMLink
link: Daniel L. Thornton, Vice President and Economic Adviser: Research Division, Federal Reserve Bank of St. Louis, Working Paper Series
“Monetary Policy: Why Money Matters and Interest Rates Don’t”
bit.ly/1OJ9jhU
“Today “monetary policy” should be more aptly named “interest rate policy” because policymakers pay virtually no attention to money.”
Link: Daniel L. Thornton, May 12, 2022:
“However, on March 26, 2020, the Board of Governors reduced the reserve requirement on checkable deposits to zero. This action ended the Fed’s ability to control M1.”
Thank you Salmo. I was kind of forgetting that the free credit the Fed was handing out after the Financial crisis prevented it from controlling the lower level of interest rates. And that the RRP was created to prevent this.
(Compounding the Fed’s interference, for worse disaster at some point when all the bandages come flying off.)
On another controversy that Salmo has emphasized (Richard Werner interview), re. what function the banks actually perform - financial intermediaries, fractional reserve or money creators - I find it incomprehensible that this is not agreed upon by economists after all this time. It should be as simple as 2+2=4.
Perhaps some of the things that complicate it are double entry accounting itself (credits and debits), and the legality of whether a loan by a bank is in fact a loan, or the purchase of an IOU, but this article below seems to make sense on the correct way to characterize banks ability to create money:
https://cepr.org/voxeu/columns/banks-do-not-create-money-out-thin-air
Never are the commercial banks intermediaries between pooled savings and borrowers. From the standpoint of the entire system and the economy (macro-economics), commercial banks never loan out, & can’t loan out, existing funds in any deposit classification (saved or otherwise), or the owner’s equity, or any liability item. Every time a DFI makes a loan to, or buys securities from, the non-bank public, it creates new money - demand deposits, somewhere in the system. I.e., deposits are the result of lending and not the other way around.
This can be demonstrated by examining the differences in the consolidated condition statements for commercial banks, plus the monetary system, for any two points in time. For the commercial banking system, this requires constructing a balance sheet for the system, an income & expense statement for the system, & a simultaneous analysis of the flow of funds in the entire economy.
Notwithstanding the BOE’s explanation, this is revealed by examining all the outside factors that alter the volume of DFI deposit liabilities. While there are many factors which can, and do, alter the volume of bank deposits, and these items are large, taken in aggregate, outside factors, e.g., (+) Reserve bank credit, (-) bank capital accounts, (-) increases in currency held by the non-bank public, etc., collectively are nevertheless offsetting, indeed peripheral, when netted.
The volume of savings effected by the public, the choices made by the pubic in the disposition of savings, and the size of the various intermediary financial institutions, affect the size and earning capacity of the banking system only as these factors affect monetary policy.
The increased lending capacity of the financial intermediaries is comparable to the increased credit creating capacity of the commercial banks in only one instance; namely, the situation involving a single bank which has received a primary deposit and all newly created deposits flow to other banks in the system.
But this comparison is superficial since any expansion of credit by a commercial bank enlarges the money supply, whereas any extension of credit by an intermediary simply transfers the ownership of existing money.
Some people are predicting a rapid fall-off in inflation.
Here is truflation:
Today's CPI Data by Truflation
USA
The USA Inflation Rate by Truflation is 2.74%, -0.01% change over the last day. Read Methodology
---30---
BTW, kudos to longtime Apple fan Scott Grannis.
"Apple shares closed at an all-time high, putting the company within striking distance of achieving a historic $3 trillion valuation. Shares rose 1.6% to end the session at $183.79 — bringing the tech giant’s gain to 41% this year. The new high comes less than a week after Apple unveiled new products including its Vision Pro headset, with high hopes it will become the next smash hit. The release of the Vision Pro has already got people wondering what the world will look like with hordes of people wandering around wearing augmented-reality goggles. Here’s what that collision of digital and physical spaces might mean for our cities."
---30---
A single company with a market-cap of $3 trillion. Amazing.
Hedge Fund Bond Bears Are Relentlessly Shorting Treasuries [Bloomberg]
Leveraged investors boosted their net-short two-year Treasury positions for an eleventh straight week in the period to June 6, the latest Commodity Futures Trading Commission figures compiled by Bloomberg showed. That’s the longest run on record, according to data going back to 2006…. On an aggregate basis, hedge funds also added to record net short Treasuries bets in the same period, according to the data. Some of these wagers could also be linked to the so-called “basis trade,” where speculators seek to profit from small differences in the yield between cash Treasuries and corresponding futures
Without comment. Clay
Interest is the price of credit. The price of money is the reciprocal of the price level.
ZeroHedge doesn't know the difference:
https://www.zerohedge.com/markets/fed-fkery-continues-massive-non-seasonal-bank-deposit-inflow
To wit: "Which seems a little odd given the massive MM fund inflows - that's quite a decoupling?"
The NBFIs, e.g., MMMFs, are the DFIs customers. Savings flowing through the nonbanks never leaves the payment's system.
Headline CPI for May 2023
3-month annualized rate: +2.2%
6-month annualized rate: +3.2%
12-month change: +4.0%
The deceleration in the rate-of-change in the growth of the CPI is encouraging.
You seem to assume that the long-term 6% growth of M2 is acceptable if not good. It's neither good or acceptable. That growth has crushed M2V over the last quarter century. We have a huge government debt problem (fiscal problem). Use the tools on the St. Louis Fed website to create a chart showing M2 and publicly held government debt - the correlation is striking.
Thanks always, Scott. Love reading your material.
John Mauldin wrote an interesting piece last week on the impact of the Millennial generation, tax incentives on home borrowing and the resulting impact inflation. Since housing is such a large part of the CPI, I wonder if it will be more time until we really see the headlong number come down.
https://www.mauldineconomics.com/frontlinethoughts/a-funny-kind-of-recession
Thank you for the information. Very helpful.
As a trader(mostly options), my view that the US Equirty/stock has been/is now, like a casino.
YTD % Change of 3 stocks NVDA(190%), META(138%), TSLA(126%) . . .
P/E ratios also make little sense eg: CRM 522, AMZN 251. et etc.
So "the market" is not an indicator . . . .
Retired/banker/physicist/software developer
Mano
San Jose, CA
Post a Comment