


The news today was supposedly disappointing—GDP growth in the first quarter was weaker than expected, while inflation was a bit higher than expected—but I disagree. I see the economy continuing to grow at about a 2% rate and I see inflation falling. Here are two charts which I think give you a better picture of what's happening on the growth and inflation front.
Chart #1
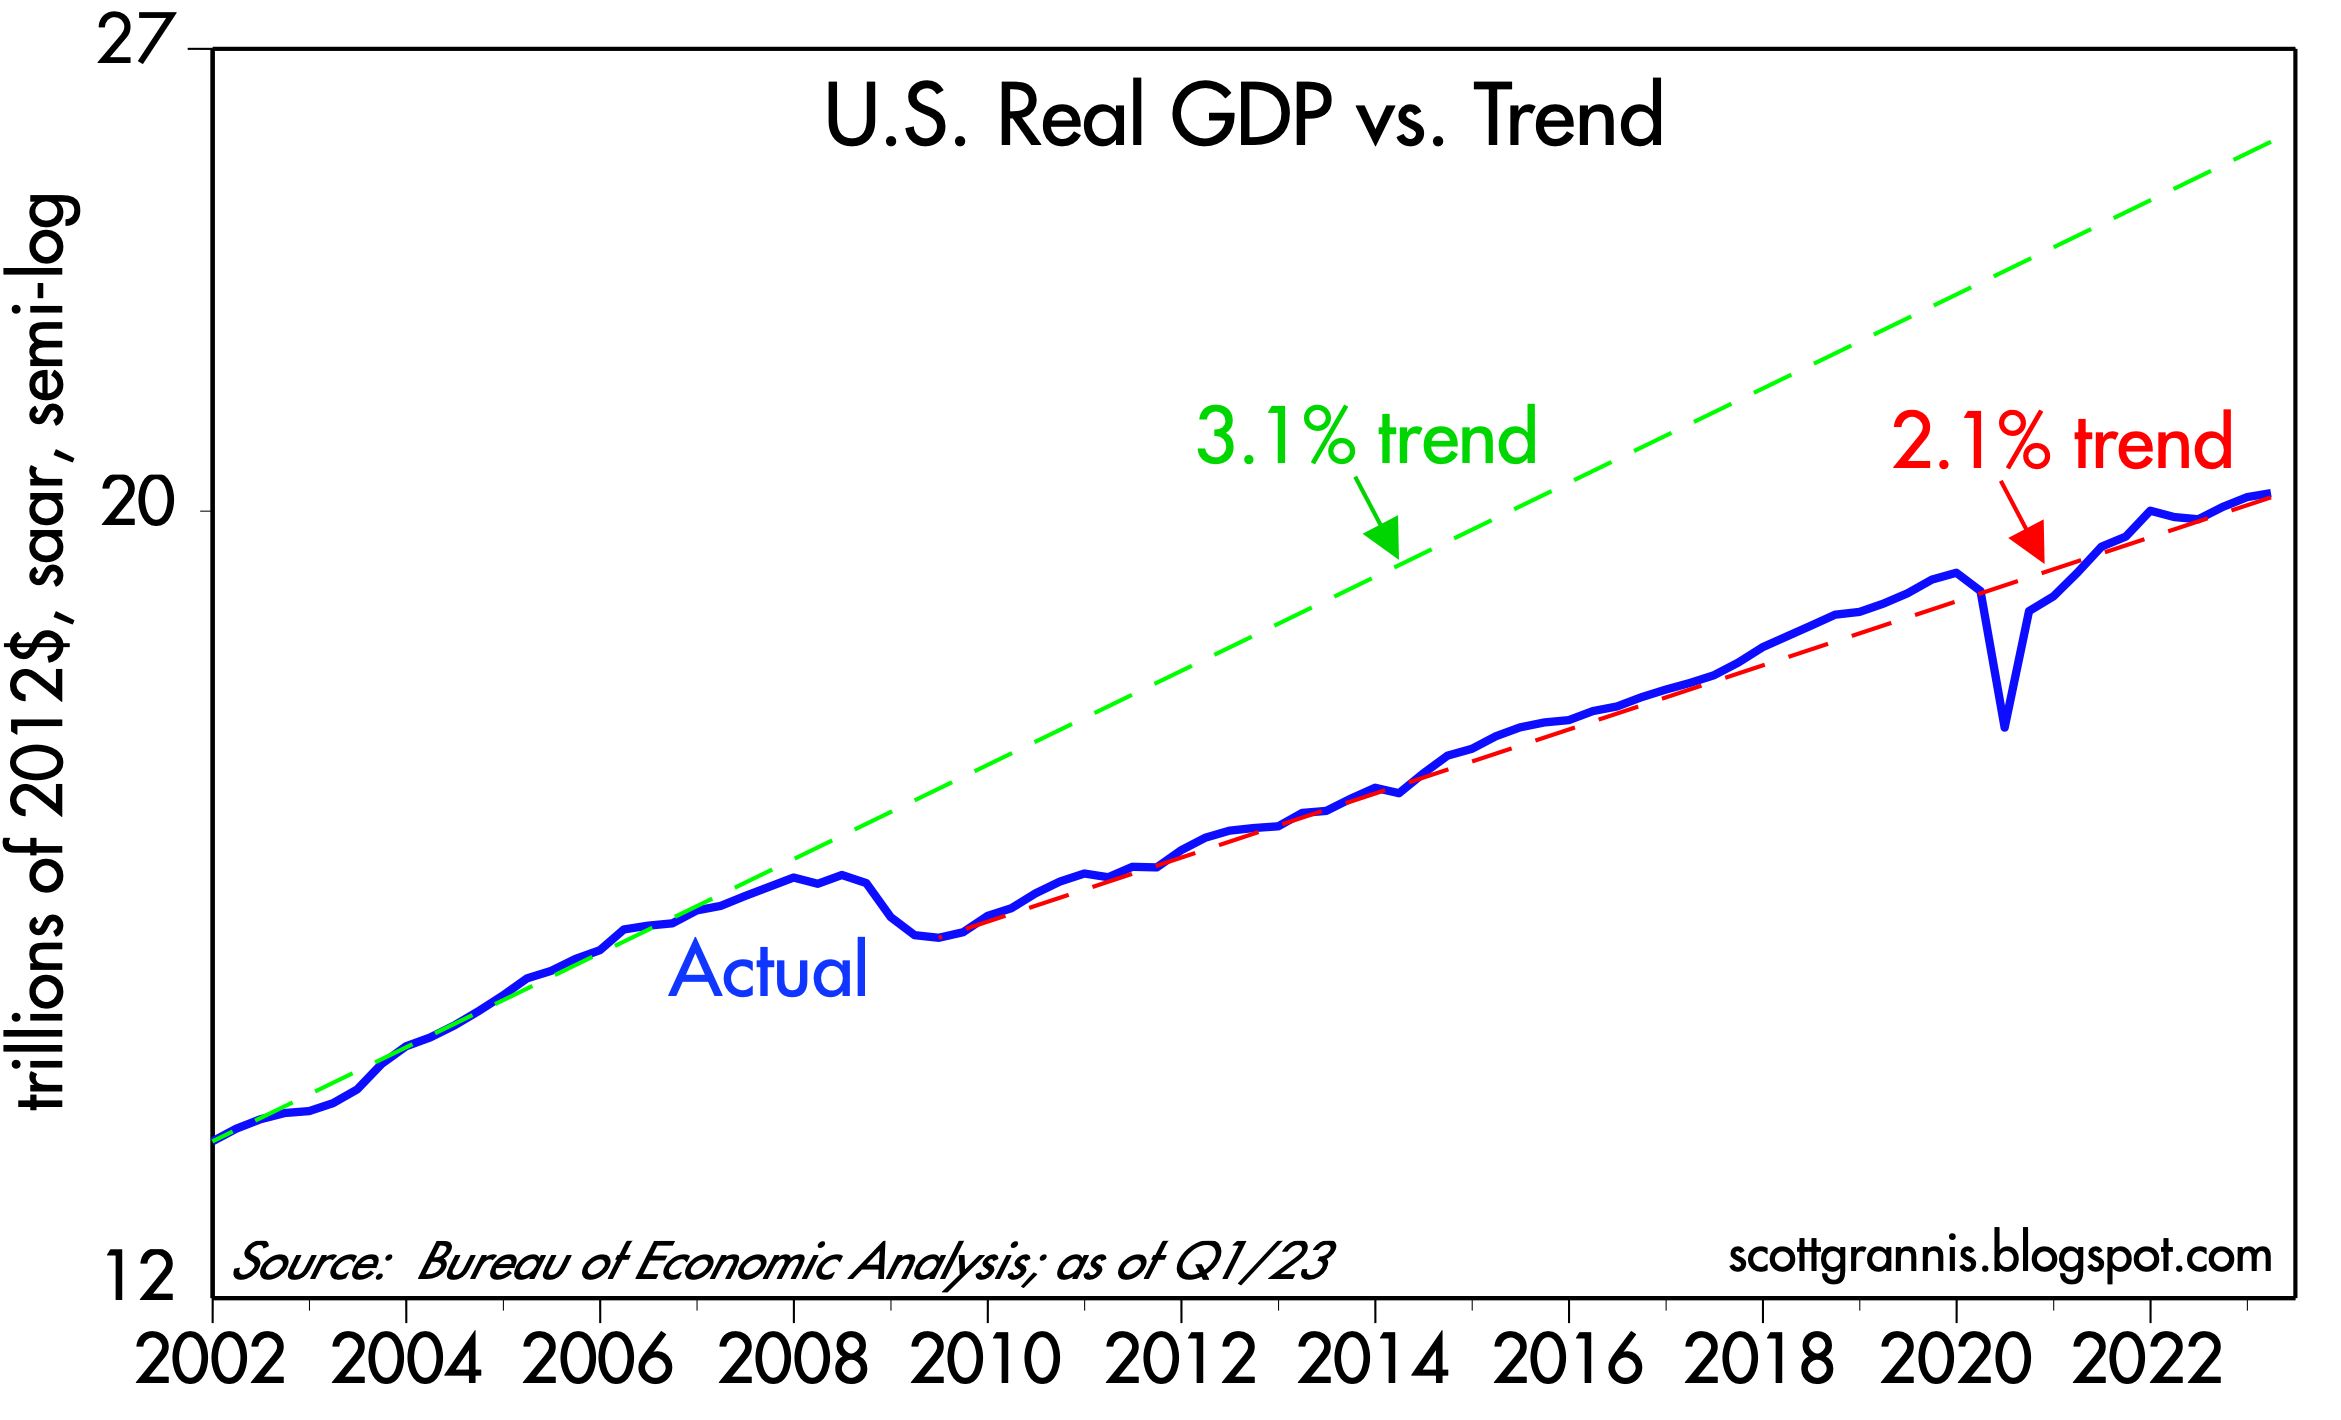
Chart #1 compares the level of real GDP to different trend lines. (Note that the y-axis is logarithmic, so a straight line equates to a constant rate of growth.) From 1965 to 2008, the economy grew by about 3.1% per year on average. But then the economy's growth dynamics changed dramatically following the Great Recession of 2008-09. Since the recovery started in mid-2009, the economy has grown by 2.1% per year on average. Why? I see lots of policy headwinds: Huge increases in tax and regulatory burdens, huge increases in transfer payments, and huge spending on (inefficient) green energy sources, to name just a few, all of which I've discussed at one time or another over the years.
Yes, annualized growth in GDP fell from a 2.6% rate in the fourth quarter to a 1.1% rate in the first quarter, but those are annualized figures which magnify the actual change in the quarterly levels. Note how you can hardly see this change in the blue line on the chart. Moreover, the mini-recession that supposedly happened in the first half of last year is just a wiggle on this chart. The broad growth trend remains about 2%.
The net result is that 14 years of anti-growth policies have cost us over $5 trillion in lost output. Put another way, if nothing had changed since 2008, the economy would be about 25% bigger today—and incomes would also be 25% higher. To be fair, I note that demographics have changed; baby boomers retiring have reduced the growth of the labor force. Nevertheless, it's also true that the labor force participation rate has fallen from 66% in 2008 to now 62.6%. That means that some 5 million people of working age have decided to not work. I've tied that to a big increase in transfer payments, which I explained here.
Chart #2

Finally, it's worth noting that swap spreads and credit spreads continue to be relatively low and well-behaved; there is nothing in those statistics which foreshadows a recession. Corporate profits have been mixed, but there have been some pleasant upside surprises of late in the tech sector (e.g., GOOG and META). A recession is far from being "baked in the cake." Nevertheless, the yield curve is still quite inverted, which means the bond market is pricing in the strong likelihood of a recession and an eventual Fed ease. In fact, the bond market assigns a high probability of another 25-50 bps rate hike at next week's FOMC meeting.
The Fed may well hike next week, but that would be a mistake in my view. If they do (because they want to regain some of the credibility they've lost over the past year or so), it won't be a surprise to the market. But if they don't, that would be a nice surprise. In any event, I prefer to bet on what is going on in the economy, not what is going on in the heads of the FOMC members. The Fed may be late to react to the economic realities, but react they will, and that's the bigger story I prefer to follow.
An economy growing at a modest 2% rate, inflation by all measures declining significantly, combined with interest rates that are high enough to cause pain in many sectors of the economy, do not add up to a rationale for another rate hike next week.
UPDATE (April 28): Today we received the March figures for the Personal Consumption Expenditure Deflators, which are measures of inflation at the individual level which are arguably superior to the CPI, mainly because they cover a broader basket of goods and services and the weightings of the components adjust dynamically as the economy and consumer habits change. Over long periods, the PCE deflator tends to register about 0.5% less inflation per year than the CPI, which is why many believe that the CPI tends to overstate inflation. It also explains why the Fed prefers to focus on the PCE deflator even though they talk a lot about the CPI. Chart #3 compares the two measures on a year over year basis.
Chart #3

Chart #4

Chart #4 looks at the 3 components of the PCE deflator: services, durable goods, and non-durable goods. It starts at 1995 since that was the year after China devalued its currency for the last time and simultaneously began its long march to become the world's biggest exporter of durable goods. It also marked the first year that the durable goods component of the PCE deflator turned negative. China did become a global powerhouse in durable goods and in the process they drove durable goods prices lower worldwide. US durable goods prices today are 31% lower than they were at the beginning of 1995.
Another point I want to make here is that durable and nondurable goods prices today are unchanged since last June, which not coincidentally was the high-water mark for the year over year change in the CPI and the PCE deflator. In other words, service sector prices are the sole source of whatever inflation has occurred in the US for the past 9 months. It's also important to point out that the cost of shelter (housing prices and rents) is a significant portion of service sector prices, and as this post notes, that component of the CPI peaked last month. In the months to come, with housing and rental costs falling and durable and nondurable goods prices flat, overall inflation is almost sure to continue to fall.
17 comments:
Scott,
Do you see a risk of deflation?
What derails economic expansion is a shifting of demand deposits to gated deposits. Contrary to the myopic banker, from the standpoint of the system, banks create deposits, they do not lend them. This shifting destroys the velocity of circulation.
Can you hear the sucking sound?
Small-Denomination Time Deposits: Total (WSMTMNS) | FRED | St. Louis Fed (stlouisfed.org)
Large Time Deposits, All Commercial Banks (LTDACBM027NBOG) | FRED | St. Louis Fed (stlouisfed.org)
Call it the paradox of thrift or precautionary savings. But from an accounting perspective, or flow, bank-held savings, stock, are frozen.
The point is that all monetary savings originate in the payment's system. Demand deposits are just shifted into time deposits.
So, banks compete for the deposits that the system already owns. There is just a redistribution of deposits among the banks. Banks must maintain a positive "balance of payments". Their core deposits must be "sticky" or a stable source of funds (unlike "brokered deposits"). And the larger banks have economies of scale. This results in the consolidation of the banking system.
See: “Should Commercial banks accept savings deposits?” Conference on Savings and Residential Financing 1961 Proceedings, United States Savings and loan league, Chicago, 1961, 42, 43. By Dr. Leland James Pritchard, Ph.D., Economics, Chicago 1933, M.S. Statistics, Syracuse.
See: “Profit or Loss from Time Deposit Banking”, Banking and Monetary Studies, Comptroller of the Currency, United States Treasury Department, Irwin, 1963, pp. 369-386
See: Why America will soon see a wave of bank mergers | The Economist Apr 20th 2023
"When calculating their regulatory capital, banks with less than $700bn in assets typically do not have to mark to market even the securities that they class as “available for sale” and which are meant to be a source of quick cash in an emergency. Those smaller than $250bn are exempted from the strictest liquidity rules, stress tests and failure planning. This light-touch regulatory regime is now being reviewed by domestic and international regulators."
"the drawdown in inventories actually reduced the headline GDP figure by 2.26%,"
Not to be repeated.
@Salmo "not to be repeated" as in, this is not being talked about by anyone? Or as in, the next GDP figure will not be held down by such an amount?
See: “History and forms. Irving Fisher (1925) was the first to use and discuss the concept of a distributed lag. In a later paper (1937, p. 323), he stated that the basic problem in applying the theory of distributed lags “is to find the ’best’ distribution of lag, by which is meant the distribution such that … the total combined effect [of the lagged values of the variables taken with a distributed lag has] … the highest possible correlation with the actual statistical series … with which we wish to compare it.”
Thus, we wish to find the distribution of lag that maximizes the explanation of “effect” by “cause” in a statistical sense”. And “The Lag from Monetary Policy Actions to Inflation: Friedman Revisited” 2002 “We reaffirm Friedman’s result that it takes over a year before monetary policy actions have their peak effect on inflation… Similarly, advances in information processing and in financial market sophistication do not appear to have substantially shortened the lag”
“At the Dec. 27–29, 1971, American Economic Association meetings, Milton Friedman (1972) presented a revision of his prior work on the lag in effect of monetary policy (e.g. Friedman 1961). His new conclusion was that ‘monetary changes take much longer to affect prices than to affect output’; estimates of the money growth/CPI inflation relationship gave ‘the highest correlation… [with] money leading twenty months for M1, and twenty-three months for M2’ (p. 15)”
Contrary to Nobel Laureates Dr. Milton Friedman and Dr. Anna Schwartz’s “A Program for Monetary Stability”: the distributed lag effects of monetary flows (using the truistic monetary base, required reserves), have been mathematical constants for > 100 years.
Dr. Richard G. Anderson says: “reserves were driven by payments”.
I.e., the 10-month rate-of-change in our means-of-payment money, the proxy for real output, has yet to turn negative.
I'm reprinting this comment from the previous post Comments section:
To judge from the current level of interest rates, the market seems convinced the Fed will raise rates 25 bps tomorrow. But the market is also convinced that the Fed will then need to cut rates several times before the end of the year. This is madness.
With the bank crisis again in full bloom and stocks down today, another tightening tomorrow would seem nothing short of madness. The bond market is telling the Fed that inflation is under control already: 5-yr inflation expectations have fallen to a mere 2.2% today. The dollar is trading at reasonable levels; not too strong, not too weak. Commodity prices are soft; oil is down 40% from the level that prevailed last June.
Most importantly, the banking crisis is the direct result of the Fed's tightening actions over the past year or so. Sharply higher bond yields have severely impacted the bond portfolios of all the nation's banks. So another tightening at this point would only add fuel to the fire.
Simply put, the Fed needs to cut rates. Now. That would relieve all the negative pressures that have accumulated.
Not only will they raise they might even say there will be no cuts this year. Maybe another raise in June.
Considering all their wrong decisions during the past years it's unreasonable to expect they would do the right thing today or in the future.
Scott, do you have any thoughts on the USD compared to EUR or other currencies? Thanks.
People don’t understand it, but interest is the price of credit (bank credit, plus nonbank savings). The price of money is the reciprocal of the price level.
Waller, Williams, and Logan seem to agree. They “believe the Fed can keep unloading bonds even when officials cut interest rates at some future date.”
The FED should cut interest rates now, and continue with QT. The 1966 Interest Rate Adjustment Act is prima facie evidence.
Reuters: “These officials also noted the Fed at some point could even lower short-term interest rates as it continues to draw down the roughly $8.5 trillion balance sheet, and that such a move would not be at odds with wider monetary policy.”
The FED should cut interest rates NOW – and continue with QT. The 1966 Interest Rate Adjustment Act is prima facie evidence.
The deregulation of interest rates for the commercial banks, Reg. Q ceilings, was vitiated on the largely false premises on which deregulation is based, viz., that bank deposits in commercial banks constitute the “savings’ of the depositors, that these are “lent” to the banks, and that the commercial banks are only a “medium” through which this end is affected [sic].
You don’t get a recession unless the 10-month rate-0f-change in money flows, the volume and velocity of means-of-payment money, the proxy for R-gDp, turns negative.
I got the 10mo roc in RRs from The Bank Credit Analyst, from their debit/loan ratio.
As Dr. Richard G. Anderson (Ph.D. Economics, MIT), Emeritus, FRB-STL (world’s leading guru on bank reserves), stated: Sent: Thu 11/16/06 9:55 AM:
“Today, with bank reserves largely driven by bank payments (debits), your views on bank debits and legal reserves sound right!”
This is the GOSPEL
http://bit.ly/1A9bYH1
The problem is that Reg. Q ceilings were removed by the DIDMCA (“allocation of funds across sectors”).
And the NBFIs are not in competition with the DFIs. Disintermediation is made in Washington.
“No member bank shall, directly or indirectly by any device whatsoever, pay any interest on any deposit which is payable on demand … The Federal Reserve Board shall from time-to-time limit by regulation the rate of interest which may be paid by member banks on time deposits, and may prescribe different rates for such payment on time and savings deposits having different maturities or subject to different conditions respecting withdrawal or repayment or subject to different conditions by reason of different locations.” – Section 11(b) of the Banking Act of 1933
Money demand, M2/GDP, is still high:
https://fred.stlouisfed.org/graph/?g=eTtE
The deceleration in M2 is entirely due to dis-savings (drop in savings deposits relative to means-of-payment money). At some point, this decrease in money demand, temporary rise in Vt, will end.
In Alfred Marshall’s “Cash Balances Approach” (the demand for money), K = “the length of the period over whose transactions purchasing power in the form of money is held”. K is related to Vt; it is the reciprocal.
The increase in large time deposits demonstrates an increase in velocity.
Large Time Deposits, All Commercial Banks (LTDACBM027NBOG) | FRED | St. Louis Fed (stlouisfed.org)
As Dr. Philip George says: “The velocity of money is a function of interest rates”
As Dr. Philip George says. “When interest rates go up, flows into savings and time deposits increase”.
As Dr. Philip George puts it: “Changes in velocity have nothing to do with the speed at which money moves from hand to hand but are entirely the result of movements between demand deposits and other kinds of deposits”.
Post a Comment