


The most significant development is the extraordinarily low level of real and nominal interest rates in the US and in most major developed economies. I believe that very low interest rates are not necessarily a sign of an impending recession, but instead likely reflect widespread risk aversion among market participants. Moreover, widespread risk aversion lessens the chance of negative surprises.
Chart #1

As Chart #1 shows, yield curve inversions (when the red line becomes negative) have preceded every recession since the 1950s. But there is one other variable which has also preceded every recession, and that is a real Fed funds rate (blue line) that is high and rising (e.g., at least 3-4%). Currently, the real funds rate is barely positive, which means that monetary policy is far from being so tight as to strangle the economy or to starve the market of much-needed liquidity.
Only one of these two classic recession indicators is flashing red. That the other is not is due to the fact that monetary policy since 2009 has functioned in a very different way than it did prior to 2009. Prior to 2009 Fed tightening involved draining reserves (which at the time paid no interest) from the banking system, which in turn pushed up the Fed funds rate and made borrowing more expensive. It also restricted liquidity in the banking system, which often exacerbated problems stemming from rising real borrowing costs. Since late 2008, monetary policy tightening has only involved a decision by the Fed to increase the rate of interest it pays on bank reserves (something it never did before); meanwhile, bank reserves have remained abundant, and liquidity has generally remained plentiful.
Chart #2

As Chart #2 shows, the recent decline in real yields on 5-yr TIPS (from just over 1% prior to late 2018 to now zero) suggests that the market expects the economy to slow to a 2% pace going forward. As the chart further suggests, real yields on TIPS have a tendency to track the real growth trend of the economy. Today's low and negative real yields do not necessarily imply that the market is expecting a recession, more likely simply a slowdown in the pace of growth. And to date, that appears to be exactly what is happening, thanks in large part to the uncertainty and disruption caused by Trump's tariff war with China.
Chart #3

Chart #3 shows 2-yr swap spreads, which are not only excellent indicators of financial market liquidity conditions, but also excellent predictors of economic health. Swap spreads are very low these days, both in the US and in the Eurozone. This is a strong indication that liquidity remains plentiful—let's not forget the almost $1.5 trillion in excess bank reserves—and systemic risk remains low. All positive for future growth prospects.
Chart #4

Chart #4 shows that small business owners are quite optimistic about current and future business conditions. That's important, because they are the main engine of jobs growth. Optimism is up significantly since Trump's election, and Trump's efforts to slash regulatory and tax burdens get a good portion of the credit for this in my book.
Chart #5

Consumers in general are also quite confident these days, as Chart #5 shows. Trump's election helped spark a surge in consumer optimism. Healthy business and consumer optimism at the very least suggests the absence of any deterioration in the health of the economy.
Chart #6
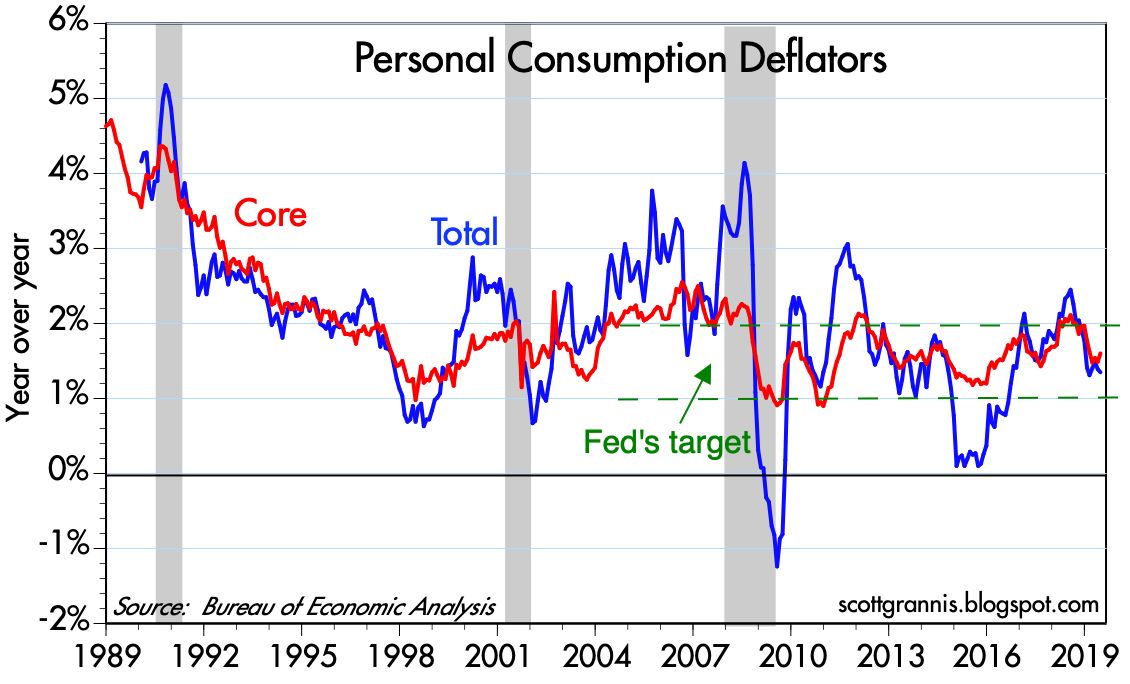
Chart #6 shows that rising inflation has typically preceded recessions. That makes perfect sense, since very tight monetary policy has been needed to bring inflation down, and as Chart #1 showed, tight monetary policy (marked by high real rates and an inverted curve) is the main reason recessions have occurred in the past. Today there is no problem at all with inflation, and thus no reason for the Fed to tighten. In fact, they are very likely to ease at the next FOMC meeting, if not before, as I argued earlier this month.
Chart #7

As Chart #7 shows, recessions have typically been preceded by rising unemployment claims. Claims are a high frequency statistic that is released with a lag of only a week or so, so they are timely indicators of the health of the labor market. Currently, claims are very low and show no sign of rising. Businesses are therefore quite happy with the size of their workforce. If anything, the main problem facing most businesses these days is the difficulty of finding new hires.
Chart 8

As Chart #8 shows, deteriorating financial conditions also precede recessions. So far there has been no significant deterioration in Bloomberg's measure of financial conditions, which is quite comprehensive.
Chart #9

Chart #10

As Charts #9 and #10 show, rising corporate credit spreads also precede recessions. Today, however, they are quite low. This means that financial market participants have little or no reason to fear a significant deterioration of corporate profitability. In fact, today's low credit spreads are a good indicator that the outlook for corporate profits (and, by inference, the economy in general) is healthy.
Chart #11

As Chart #11 shows, fixed-rate mortgages are about as cheap as they have ever been. That's one reason the housing market continues to hold up well. Consumers are not being squeezed by high rates.
Chart #12

Chart #12 is one measure of the shape of the yield curve that is looking just fine. The very long end of the curve is mostly immune to Fed policy and Fed policy expectations, unlike the front end of the curve, which is where all the inversion is happening. The long end is nicely positively-sloped, which means that the market's long-term expectations for the economy and the outlook for inflation remain healthy.
Chart #13

Chart #13 (a new chart making its first appearance on this blog) shows the 3-mo. annualized rate of growth of demand and savings deposits at U.S. banks. I consider this to be a proxy for money demand, since the interest rate paid on these deposits is very low. People hold them mainly because they want to keep their money safe. What stands out is the recent and significant increase in the amount of money being stashed in these safe havens. Not surprisingly, this coincides with the recent bout of nerves triggered by Trump's trade war with China.
The big thing happening on the margin is a flight to quality/safety. (This shows up in the rising price of gold as well.) Strong money demand (and by inference strong risk aversion) is the driver behind the yield curve inversion, because the Fed has been slow to respond to an increased demand for money by reducing short-term interest rates.
Chart #14

10-yr Treasury yields have plunged this year, and are now closing in on all-time lows. But it's a phenomenon that is happening all over the developed world. As Chart #14 shows, yields in Germany and Japan are much lower than ours. Strong foreign demand for Treasuries could well be one of the main drivers of lower yields, since our yields are still much higher than anything you can find in major overseas markets. In short, there is a lot of risk aversion globally, and that is creating exceptionally strong demand for government bonds.
Chart #15

Chart #15 highlights the behavior of 10-yr real yields in the U.S. and Germany (and by inference the entire Eurozone). Eurozone real yields are now at record lows, and far below their U.S. counterparts.
Chart #16

As Chart #16 suggests, the huge difference between real yields here and in overseas markets is being arbitraged by market forces. The spread between US and German real yields has been narrowing sharply so far this year, at the same time as the dollar has been rising against the Euro, because money is leaving Europe in search of higher returns in the US.
Global risk aversion and a flight to safe havens is what's going on behind the scenes just about everywhere—not fears of recession. It shows up in very low and negative yields (because demand for sovereign bonds is extremely strong), and in rising gold prices.
Chart #17

As Chart #17 shows, equity valuations are not out of line with the level of real yields. Both tend to move together. High real yields typically accompany strong economic growth and strong corporate profit growth, which drives PE ratios up. The equity market itself is displaying signs of risk aversion, even as PE ratios are above average; small caps are underperforming large caps, and that happens when people see slowing economic growth.
Risk aversion appears to be significant, but it's not necessarily something to worry about. A risk averse market is less prone to disappointments, and more able to withstand adverse shocks.
17 comments:
Another great post by Scott Grannis. You can agree or disagree with Scott Grannis, but the quality of his blogging, and his openness to commentary, are tops.
Recently, Bank of England Governor Mark Carney addressed the Jackson Hole shindig, and basically he said long-term interest rates are set globally, and we live in a world of globalized capital markets.
Ben Bernanke and some others say global capital markets are flooded or glutted. I suppose that is a matter of semantics, but I think it is valid viewpoint. When $17 trillion of bonds offer negative interest rates, maybe some flooding is going on. US 30-year Treasuries are at record lows. No reasonable deal in property goes unfunded, and many edgy deals are funded. Same in VC.
The US central bank might be able to artificially prop up some short-term rates, through IOER and some other mechanisms. But the long-term rates are sagging on globalized markets. So we might see an inverted yield curve that conveys less information than before.
The other remarkable aspect of the newish, globalized and flooded capital markets is that they have stripped the Fed of its sidearms. The Fed can lower short-term interest rates in the US, or prop them up a bit. So what? The Fed can buy a few trillion dollars of assets in globalized asset markets (now about $350 trillion in bond, stocks and property). So what? What will change?
I think this is one reason why BlackRock, Pimco and Ray Dalio are calling for money-financed fiscal programs.
The world has insatiable demand for safe assets and US dollars. Fine, let us give them dollars. But instead of issuing US bonds and incurring debt, print up the extra dollars and give US taxpayers, especially the employee class,, a tax break. Print money and fund Social Security with it, and cut payroll taxes.
The Fed cannot fight the next recession with the tools it has now. The Treasury can fight the next recession by borrowing globally and spending locally---but that runs up debts. Behind Door Number 3 we have...the winner! A helicopter!
I echo Ben's sentiments re your blogging Scott. Truly excellent and thought provoking work-and free! Thank you.
The chart that really argues against imminent recession is consumer confidence. Of course it can turn at any time as can unemployment and WILL if DT doesn't quit this nonsensical trade war. The thing that I keep coming back to is that I seriously doubt an inverted yield curve was even discussed by one in ten as late as 2007 and now damn near everyone talks about it! Thank you social media. When everyone knows about an indicator I am skeptical as to its merits.
2020 economy (and therefore election) is in DT's hands. STOP the China nonsense and he wins.
Thanks, Scott. Great charts.
I was wondering if you might re-post the chart of Real Fed Funds vs. 5-year TIPS. This chart would highlight, I believe, that while money would seem to be plentiful based on historicals, it isn't adequate relative to the incredible demand for money. And this is why the two lines are similar to what appeared before the downdrafts in 2000 and again in 2008.
Like Benjamin, I have become a fan of helicopter money. (It was never my first choice!) If you want to force inflation higher, that's easy. Just print money. But so as not to increase our debt further (a massive and increasing problem) I say send $1000 to every social security number along with the promise to do it every six months so long as the PCE-core remains below 2%. This would have the additional virtue of positively affecting the 1/99 issue that has become so acute. I would also hack away at the payroll tax as Benjamin has mentioned. Side note: Why haven't any of the Democratic candidates proposed tax relief to working Americans via a payroll tax reduction? They could pay for it, at least in part, by eliminating the cap on income subject to the tax. This would also help the 1/99 problem. But no. The Dems show how they've abandoned the working people in this country. Total frauds.
Many thanks for your insight.
Grechster - it's funny you mention the $1000 to every SSN. I've been thinking Andrew Yang's Freedom Dividend is in effect the helicopter money that Benjamin would like to see. I bet most readers of this blog find that Freedom Dividend a ridiculous idea. I'm not on board with the idea yet, but it's sounding less crazy now that I think about it a little more. Especially if it was tied to replacing many other forms of support.
Randy--- in general, I am against social welfare programs or increased federal spending (including, by the way, federal military and agriculture programs).
Social Security benefits may have a welfare component, but in general benefits are paid to people who paid into the system. These are earned benefits.
In general, for any society to be sustainable, income must be earned by working or investing. I never have a problem with giving tax breaks to people who work for a living. And yes, if I have to tilt my head, I will tilt my head to people working, say, in the bottom half of the income spectrum.
I sure wish somebody would seriously examine payroll tax cuts.
This topic with these graphs is by far my favorite. This is such a great post and summary. So good.
Thank you for the comment of the current situation, it is always a pleasure to read it from Barcelona
Piece in The American Spectator says it all;
"In saying the Fed “loves watching our manufacturers struggle,” and asking, “who is our bigger enemy, Jay Powell or Chairman Xi?” Donald Trump’s criticism of the Fed transgresses the bounds of decency. Bill Dudley’s suggestion, if followed, for the supposedly independent body to act as an auxiliary of the Democratic National Committee violates law. Perhaps worse still, such a course would cause great harm to the same American people he imagines his advice ultimately helping. Who but a politically obsessed loon hopes for people to lose jobs, homes, savings, and much else just to save the White House for a favored candidate? At least when Trump meddles in the Fed’s business, he does so with an eye toward growing the economy (even if a skeptic sees that aim as tethered to his electoral aspirations)."
DT's treatment of the Fed is absolutely apalling for a POTUS. Petulant. BUT, Dudley's response? political, biased and just criminal.
Why is there not more outrage?
What is the US government do to if there is a recession; cannot lower rates (done that already), cannot spend (is doing that already). Its amazing that the same bunch that was screaming that the deficit was such a huge problem when Obama was president now don't even mention it. Did you all know that the annual deficit was $660 trillion in 2017, it will be around $1.1 trillion in 2019 and is estimated to be around $1.2 trillion in 2020!
Apparently that's no longer a problem, of course it will be a problem when congress decided that it needs to cut spending (hello Social Security, Medicare, Medicaid, and all other none defense related expenses.
Despite what CBP says there will "eventually" be a recession. My guess it will not be under Trump's administration, he's pushing a pure Keynesian pump bosting push with his tax cuts and unchanged spending.
Last year the federal government's deficit was 4.2% of GDP it's projected to be around 4.6% this year. America is starting to look like France....
No America has no new tools to find a recession, its in full fire fighting mode right now!
Scott, insightful post as always, much appreciated. I see in your approach to reading the economy and markets that you attempt to gather a wide variety of information and link together the various messages (or lack thereof). I can see this would help you to avoid overlooking important counter-factuals and also gives you a sense of whether the implied conditions and the guidance they provide are reliably strong, or insubstantially weak.
I was wondering about how one goes about confirming the idea that risk aversion is the driver of declining yields in the short terms. I started with a peek at foreign purchases of US Treasuries to understand if overseas demand is up, but that didn't seem very conclusive (or comprehensive!) Your approach is instructive; it appears you are circling the question by checking for specific elements of confirmation or non-confirmation. Would it be reasonable to summarize the elements as follows (?):
1. A robust economy with little signs of stress (inflation, unemployment, money supply, general financial conditions, coporate credit spreads, sm bus optimism.)
2. The inversions are limited to short duration Treasuries (i.e. long term prospects still appear strong
3. A view of money demand (recent surge in demand, though I have no clue if this is more cause or effect when it comes to recession?)
4. Market Valuation (PE vs Real yields, maintaining historical relationship)
If I were to counter this interpretation to try to test it, I guess that item 3 could also be happening if a recession were likely (as well as the short duration treasury inversion)... but the key argument against that interpretation would that current economic indicators in item 1. above are so robustly nuetral to positive.
I am sure I am missing nuance in this statement. I apologize in advance for any distortions and appreciate corrections you might offer.
S&P 500 stock market index:
January 26, 2018 = 2,873
August 30, 2019 = 2,926
Up less than 2% in over 19 months = something is wrong with the U.S. economy
The S&P 500 index tends to go about 6-8% per year, annualized. Some years more, some years less. The economy is not going gangbusters, in any event, but is probably still growing.
Given that POTUS has essentially increased the national sales tax by setting up tariffs, are the tariffs slowing the growth of the deficit? Would the deficit be even higher without the tariffs?
Really learn from and appreciate your blog Scott and the comments above a must read
Scott, what do you think of Andy Kessler's opinion in the WSJ 9/9/2019 where he contends that the inverted yield curve is largely due to "a dollar shortage"? A shortage created by the Fed buying long US Treasuries typically used in repo contracts as collateral especially during times of recession fears or other market stress. Excess demand for long Treasury collateral is pushing down Treasury yields in the shadow repo banking market. Andy goes on to explain that this shortage is also affecting foreign exchange transactions and foreign economies. He contends that negative yields on German long bonds are caused by excess demand for bunds used as collateral for repo transactions.
It's a good read and an interesting idea.
Re Andy Kessler: I think his argument is in the same vein as my "demand for money" argument. Lots of demand for money, money equivalents, and safe assets. All fit into the same framework.
Post a Comment