


If there is anything unusual out there, it's the fact that short-term interest rates have dropped some 70 bps this year, presumably because the bond market is guessing that there may be a Fed rate cut or two in the foreseeable future. I don't see the rationale for a near-term cut, but many argue that the global economy remains quite weak, and in any event our recovery—now in its 10th year—is growing long in the tooth. In short, markets are still quite cautious despite lots of encouraging news: swap and credit spreads remain quite low and stable, liquidity is abundant, real yields are low, the dollar is moderately strong and relatively stable, gold and commodity prices are relatively stable, and the threat of a trade war is receding almost daily.
I don't see the Fed doing anything near-term, but as the year progresses, I think the odds favor higher interest rates as the economy continues to build momentum.
Chart #1
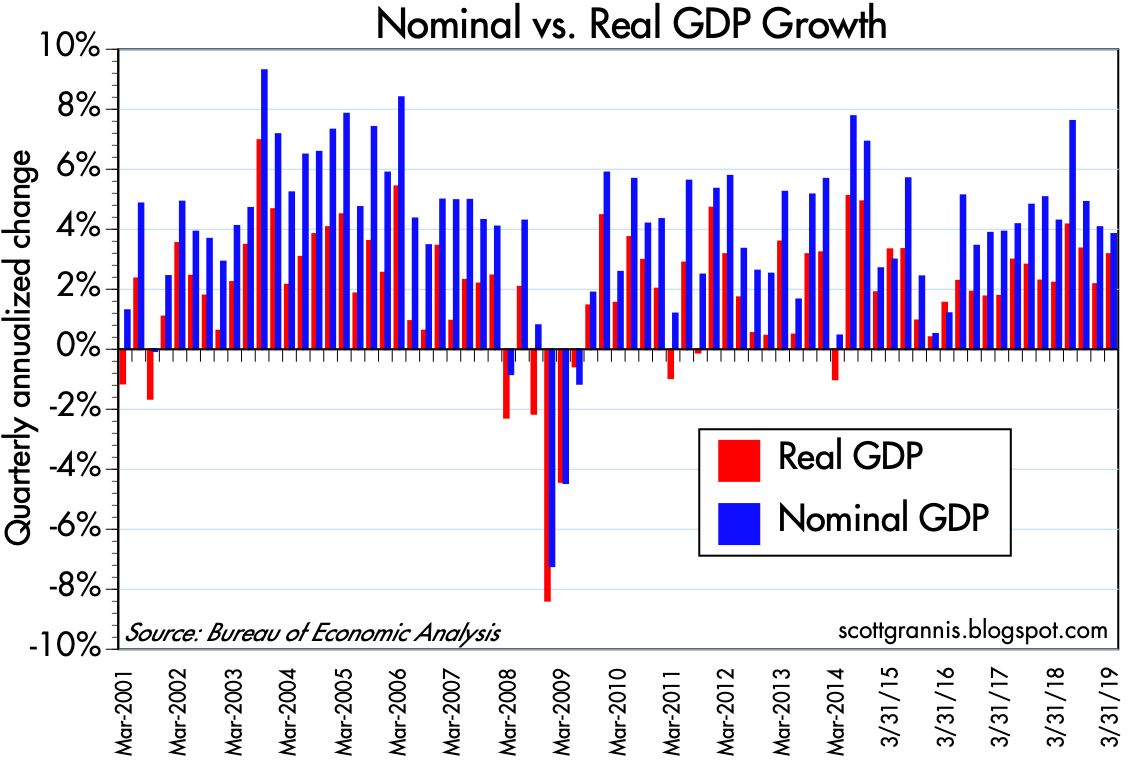
Chart #1 shows the quarterly annualized rates of growth of real (red) and nominal (blue) GDP. The red bars have been trending higher ever since 2016, but real growth is still weaker than we saw in the boom years of the mid-1990s.
Chart #2

Chart #2 shows the year over year growth of real GDP. Here we see a sustained spurt of growth beginning in late 2016 and continuing. Trump can claim to have delivered 3% growth as promised.
Chart #3

Chart #3 is my famous GDP Gap chart. It plots the level of real GDP on a semi-log axis, which makes a straight line equivalent to a constant rate of growth. Note that the economy grew on average by just over 3% per year from 1966 through 2007. Sometimes it exceeded that rate and sometimes (during recessions) it fell below that rate, but recoveries always brought the economy back to its 3.1% long-term trend. Unfortunately, the economic recovery since 2009 has failed, for the first time ever, to reattain a 3.1% growth path. In fact, it has only managed a bit over 2%, and that has led to a potentially huge shortfall. The economy today is about $3.3 trillion smaller (in terms of total annual output) than it might otherwise have been. That's a lot of annual income that potentially has been left on the table.
This of course begs the question of why the economy has failed to thrive as it did in every other recovery in the past. Demographics (e.g., baby-boomers retiring) probably accounts for some of the shortfall, but I'm suspicious of that argument: why is it that over the course of a year or so (2008-9) there was a mass exodus of workers from the workforce? Demographics work over multiple years, not just one or two. Why is it that business investment has been weaker in the current expansion than it was in the 1990s? Could it have something to do with the fact that federal debt is now almost 80% of GDP? Could it have to do with the increasing burdens of taxes and regulations? Could it have something to do with the expansion of federal transfer payments (money taken from some people and given to others) from $2 trillion in late 2008 to now $3.1 trillion?
For years I've been blaming the shortfall in growth on Big Government (i.e., growing tax and regulatory burdens, anti-business climate, burgeoning entitlement programs), but it's a tough argument to prove. However, it's encouraging to see that growth has picked up since Trump arrived on the scene and began to reduce tax and regulatory burdens. Supply-side economics is being vindicated; the economy is responding positively to lower tax and regulatory burdens.
Chart #4

Chart #4 compares the burden of federal debt (debt owed to the public as a percent of GDP) to the level of 10-yr Treasury yields. A few things stand out. For one, more debt does not necessarily lead to higher interest rates. In fact, the relationship appears to be just the opposite: interest rates tend to rise as debt burdens fall, and vice versa. Second, beginning in late 2008 the burden of federal debt has surged to its highest level since the post-war period. Surely this must have had a dampening effect on economic activity, if for no other reason than the fact that the government spends money much less effectively and less efficiently than the private sector.
Chart #5

As Chart #5 shows, after-tax corporate profits also surged over the past decade, reaching record levels relative to GDP. Federal deficits have averaged about 5.3% of GDP for the past decade, while corporate profits have averaged about 9.4% of GDP over this same period. Corporate profits have been an important source of funds for the financial markets, but federal deficits have effectively consumed the equivalent of more than half of those profits. If the federal government had not borrowed so much, in part to fund a massive increase in transfer payments (which now consume almost three quarters of federal spending, up from 65% in mid-2008), the private sector would most likely have found more efficient uses for those funds and the economy would thus be stronger.
Chart #6
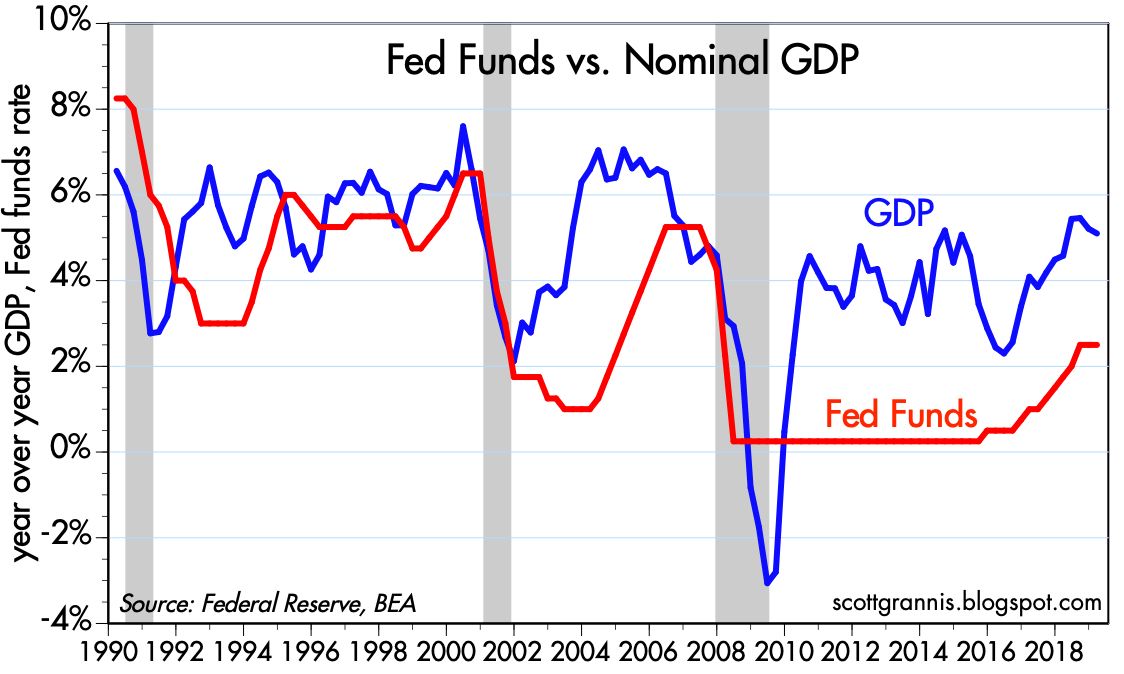
Some good news: Chart #6 compares the Fed funds target rate with the growth rate of nominal GDP. Recessions tend to follow periods in which the Fed pushes short-term interest rates up to and above the rate of nominal growth. That's otherwise called "tight money." It's similar to the flattening and inversion of the yield curve, which also typically precedes recessions (though as I pointed out recently, it also takes high real interest rates in combination with an inverted yield curve to do the trick). In short, it takes very tight monetary policy to kill the economy. Today, monetary policy is nowhere near tight.
Chart #7

Chart #7 shows 5-yr nominal and real yields, and the difference between the two (green line), which is the market's expectation for the average annual rate of inflation over the next 5 years. Here we see that inflation expectations are very much in line with historical experience, at just below 2%. We also see that there has been a pronounced decline in short-term interest rates this year: 5-yr real yields are in fact down about 70 bps from their high last December.
Chart #8

Chart #8 compares the trend growth rate of GDP with the level of 5-yr real yields. Real yields have a tendency to rise and fall in line with the economy's underlying strength. When the economy was booming in the late 1990s—growing an impressive 4-5% per year—real yields were trading in a range of 3-4%. By the mid-2010s, the economy was growing at a much more modest 2% rate, and real yields were around zero. Real yields picked up over the course of 2017 and 2018 as economic growth started to accelerate. So the 70 bps decline in real yields this year is the bond market's way of saying that the economy's growth rate is going to be on the decline for the foreseeable future, averaging perhaps 2 - 2.5% instead of the current 3%. Put another way, the bond market thinks the economy is going to be so weak that the Fed is going to have to cut interest rates. Inflation is not an issue, as Chart #7 shows; it's all about real growth and real yields.
If there's anything out of the ordinary here, it's interest rates, which appear too low given the fact that the economy appears to be picking up speed.
19 comments:
Another superb post by Scott Grannis.
A thought, not a criticism: Capital markets are now globalized. If true, then interest rates are set globally and not directly in relation to any particular action by a lone central bank, such as the Federal Reserve. There are other major central banks and also other major economies generating demand and savings.
In addition, the US runs a current-account trade deficit of around $800 billion annually. I keep reading that $800 billion axiomatically enters US capital markets.
It seems to me the decline in US interest rates in 2019 could represent some global trends which are unrelated to Fed posturing.
I hate to say it, but the multi-decade trend is that capital is becoming less and less dear and rather abundant. Actually, this should be good news as soon as we can figure out how to maintain high and rising aggregate demand.
And yes, free markets!
Chart #5 shows 5-yr nominal and real yields, and the difference between the two (green line), which is the market's expectation for the average annual rate of inflation over the next 5 years.
Just a little typo there, Scott. Should read "Chart #7".
Chart #4 is damn concerning. After WW2 there was no doubt that government spending would be cut egregiously and it was. Now? No way. I maintain that bond yield prices are reflecting supply and demand-and fear. Fear that the crazies (socialists) will take over in 2020. It's a tangible risk and unfortunately a growing part of our electorate are leaning left and are just IGNORANT when it comes to Eco 101.
steve: thanks for catching the typo! As for Chart #4, there are two ways that the burden of debt can decline: 1) we can shrink annual deficits, and/or the rate of nominal GDP growth can accelerate. #2 could involve higher inflation, of course, in which case we would be reducing the debt burden by deflating the dollar—inflating our way out of debt, which is how the Argentines typically do it.
I would agree with you on why interest rates are so low: fear/caution-driven demand for Treasuries. That could take many forms and could include foreigners who view Treasuries as an attractive hedge for their own economies, especially since interest rates in Europe and Japan are far lower than ours. But if the world were concerned about the US going socialist, then I would expect to see the dollar and the stock market getting trashed, and that's not happening.
Scott, my only response to your comment is that bond buyers and traders are by their very nature more conservative than stock traders. Hence, the prices going in the same direction. The dollar seems to be driven by so many forces and variables as to be almost random. Trading the US dollar must be an exercise in futility.
Scott,
First, I would like to thank you for taking the time to run this wonderful blog. I have been reading for several years and have learned a lot from you. Your use of charts and your explanations really make some complicated subjects understandable.
Lately, I have been thinking about the effect of stock buybacks on GDP. It seems that before the early 1980's, buybacks did not really occur, but then from the early '80s until about 2005 buybacks averaged about 1% of GDP per year. Since the great recession timeframe until 2017, buybacks increased significantly to about 2.5% of GDP. In 2018, they increased again to more than 3% of GDP, coinciding with tax reform. This resulted in bi-partisan discussions starting in congress earlier this year, about ways to limit buybacks since this was not the intended purpose of tax reform.
So what do you think... is it possible that these increases in the magnitude of buybacks could be limiting GDP growth as this represents money that is not being reinvested into businesses... could this be partly responsible for GDP trend of Chart #3 as well as partly explain why the Trump tax reform has not yet resulted in the expected economic boom?
Thanks,
Joe
Joe, re buybacks: The short answer to your question is no. John Cochrane has written extensively and wisely about buybacks, and you can read him here: https://johnhcochrane.blogspot.com/search?q=buybacks
Just because a company decides to buy back shares of its own stock instead of investing more in its business does not imply that the economy is worse off for that decision. They money shareholders receive from buybacks is most likely being reinvested by shareholders in other businesses. Buybacks are actually good if they prevent a company from squandering its own profits in stupid investments.
Politicians have tried to paint buybacks with an "evil/greedy capitalists" brush. Why? Because they would like to grab some of those profits and redistribute them to their political base in one form or another. It's greedy politicians we need to worry about, not greedy capitalists.
"It's greedy politicians we need to worry about, not greedy capitalists."
Truer words were never spoken and PITHY too!
If a company is buying back X shares,
and they have also given away x shares
as bonuses to employees, the buybacks
would only offset the earnings dilution
from giving away shares to employees.
So there would be no net effect.
The actual effect depends on:
-- Who sells their shares to the company
buying back, and what they do with the cash they get, and
-- What the company would have done
with the money, instead of buying back shares.
Buying back shares is certainly better than
a bad capital investment, with a poor actual rate of return,
but probably not better than a good capital investment
with a good actual rate of return.
I can't see how there could be one "right answer"
for any specific company .
People who cheerlead for all corporate tax cuts,
and all buybacks, can't be right
-- if those actions improved the economy,
then the BEST corporate tax rate would be zero,
and the BEST buyback strategy
would be 100% of profits/cash flow used for buybacks,
and:
- no stock dividends,
- no hiring more workers,
- no acquisitions,
- no capital expenditures,
- no research and development.
If tax cuts are always good,
and buybacks are always good,
then more tax cuts are better,
and more buybacks are better?
No thanks.
An economy needs better products.
An economy needs more productive workers.
An economy needs sales revenue growth.
An economy needs sufficient returns
on investments to attract capital
An economy needs a government that supports business,
and doesn't spend more money than it takes in !
Buybacks don't make my list, although they were
the primary result of the Trump tax cut.
My article on the subject is here:
https://el2017.blogspot.com/2019/04/what-did-large-us-corporations-do-with.html
Buybacks, instead of capital investments,
are much less likely to create jobs within a company,
or increase future sales revenues for the company.
Capital investments contribute to
economic growth much more than buybacks.
Buybacks at very high stock valuations
are likely to turn out to be a bad investment
for the company
The same amount of money used for buybacks
at low stock valuations, could be a great investment,
and help put a floor on the stock price during a recession.
My economics blog is here:
www.EL2017.Blogspot.com
I think economic growth is best viewed
without the volatile inventory changes.
A big chunk of 1Q 2019 growth was
inventory growth
(0.65 points out of the 3.2%)
counted as good news, even though
inventories were already too high
relative to sales:
For example:
Note:
2017 Real GDP was up +2.2%, over 2016 (Trump)
2018 Real GDP was up +2.9%, over 2017 (Trump)
Obama averaged +2.2%, after the recession ended
.
.
.
4/26/19
1Q 2019 GDP
Real Final Sales
GDP minus volatile inventory changes
first 1Q 2019 estimate
1Q 2019 was +2.6% annual growth rate
4Q 2018 was +2.1%
3Q 2018 only +1.1%
2Q 2018 was +5.4%
1Q 2018 was +1.9%
4Q 2017 was +3.2%
3Q 2017 was +1.8%
2Q 2017 was +2.8% Trump
1Q 2017 was +2.6% Trump
4Q 2016 was only +0.8% Obama
3Q 2016 was +2.5% Obama
It's also good to see that the budget deficit has grown so dramatically since the Tax Cuts were passed.
It's comforting to see that the basic relationship of taking in less money means that you have less money to spend is still working. And that the magic explosive growth that is predicted by those who promote these tax cuts never really materializes and that those tax cuts do not pay for themselves with giant inflows of taxes because of the super-amazing economic growth.
If it worked differently this time than the last few times we did a big tax cut for the already wealthy, I might have to reconsider some of my ideas about money and politics.
Unknown, re budget deficit: Despite the significant tax cuts passed in 2017, federal revenues have not declined. On a rolling 12-month basis, federal revenues were $3.264 trillion in March 2017, and they were $3.339 trillion in March 2019, for a 2.3% increase. Over the same period, federal outlays rose from $3.917 trillion to $4.210 trillion, for an increase of 7.5%. Yes, the deficit increased, but one could arguably blame spending, not tax rates, for much of that increase.
Regardless, the fact that tax rates were cut significantly, yet tax revenues continued to rise lends at least some weight to supply-side theory, wouldn't you say?
I think reasonable minds agree that spending is totally out of control. I also think that reasonable people agree that the widening spread between the haves and the have-nots is long past alarming. With that in mind, why is it that in the totality of the political realm, we don't see anyone, Republican or Democrat, talk about the payroll tax?
To shrink the gap between the haves and have-nots, we need to bolster the working class while not hurting the overall economy. Why not drop the payroll tax rate? Instead of 7.65% for both the employee and employer (to fund Soc Sec and Medicare), we could drop each share to, say, 4%. This would increase the demand for jobs as well as the incentive of employers to hire. At the same time we could eliminate the cap on income subject to the payroll tax, currently $132,900. In this way, high income earners would see a payroll tax increase. But economies are most sensitive to the capital gains rate and then secondarily to the income tax rate. The restructuring of the payroll tax that I suggest above would be a boon to the working class without harming the overall economy. Perhaps most importantly, though, isn't this obviously attractive from a political standpoint? The idiotic Democrats (sorry for the repetition) prattle on about the rich and general unfairness of everything. But they never put forward anything that would actually help the 99%.
Finally, I would hack away at military spending. Cut it in half as just a start. And commit to eliminating all overseas bases. Again, by not doing this we disproportionately harm the poorer classes. And while I've long thought that we should reduce military spending radically, I think we may have reached the point where such talk isn't looked at as pure kookiness. Most people I talk to readily agree with the general sentiment. This includes many military types.
Grechster, I like it. Especially the part about defense spending which is freakin absurd.
Tax rates cut. Tax revenue increased....just like every time.
Best GDP growth and Wage growth in a decade.
Lowest unemployment rates in US history for the most marginalized people in society.
Debt to GDP ratio has stopped soaring, and may actually begin to reverse.
Isnt it obvious by now that supply-side policies are the best path to prosperity FOR ALL???
Speaking of policy....every single DEM in Congress voted against every bit of this.
And their massive unlimited Mueller investigation with 500+ subpoenas just ended as a total bust.
What in the world will DEMs run on in 2020?
Lets see if America hates prosperity or not.
Scott, Thanks for the Cochrane link.
JOHNNY DAWG WAS DELIBERATELY MISLEADING
when he said: "Tax rates cut . Tax revenues increased ..."
Stop being a Trump cheerleader, and evaluate data
without bias !
The 2017 Trump economy grew only +2.2% over 2016.
That's Obama-like.
The 2018 Trump economy grew +2.9% over 2017,
with the boost from a large corporate tax cut,
whose growth effects will fade away after a year,
but will leave more federal debt forever after
Federal tax revenues are EXPECTED to rise with inflation.
But Fiscal 2018 tax revenues were up only +0.4%
versus 2017 fiscal year -- that did NOT keep up
with inflation, by any logical inflation measurement.
Therefore, tax revenues, in constant dollars, FELL in 2018.
You are entitled to your own opinions, but not your own facts.
( If someone wants to calculate calendar year 2018 federal tax revenues
versus calendar year 2017 revenues, that would be a better comparison.
Also, it would be better to look at revenues for several years
after a tax cut -- but who wants to wait that long to opine ? )
The larger Reagan tax cuts (as a % of GDP) led to a horrible
tripling of the national debt while Reagan was president.
Seems like Trump is doing a great job increasing the debt too.
The federal budget deficit widened by 17 percent in the 2018 fiscal year,
to $779 billion, and should hit $1 trillion in fiscal year 2019.
The tax cuts most likely reduced federal revenues,
below what they would have been without the
tax cuts, although there's no way to prove that definitively.
Tax cuts funded by deficit spending only boost long-term
economic growth in the imaginations of some people.
If that were really true, the best corporate tax rate would be
zero, and that would mean happy days are here again
forever after !
.
.
JOHNNY DAWG MISLED AGAIN IN HIS THIRD SENTENCE:
"Lowest unemployment rates in US history for the most marginalized people in society"
I'm going to assume you mean black and Hispanic Americans.
Well, Mr. Dawg, I guess you didn't realize the data were first collected
in 2008, during a serious recession, so new records were EXPECTED
until the economic recovery ended. We have no data for prior economic
recoveries, so the "lowest in history" claims are misleading data mining !
And comparing anyone with DEMOCRATs is not fair --
anyone else would look good in that comparison,
as they have become so bizarre, I call them DUMBOCRATS.
They help make Trump look good, but lets not give Trump
credit for things that did not happen yet, or are based on
misleading data mining.
Cliff: You'd agree, would you not, that the principle problem with respect to the deficit in one of spending. Flows to the Treasury after a pretty meaningful tax cut were slightly above 0% growth. Let's not quibble with small numbers.
Btw, the official deficit numbers are misleading in and of themselves. There's quite a bit of off-the-books stuff. I haven't looked in a few months but if you look at yoy debt numbers, we're already over a trillion.
I believe Trumpy is trying to run a re-play of Reagan. (I assume he believes that debt doesn't matter.) The problem: when RR took office debt/GDP was 27%. Today it's about 80%. I don't know when we run into a problem but something tells me the much higher ratio is already retarding growth. (I can't believe we celebrate 3% GDP growth now. Actually, after the dismal Obama years I can believe it.)
One last thought: Why do so many people think that Republicans are sober when it comes to debt? Saint Reagan was an epic disaster on the debt question. Subsequent Republican presidents haven't been much better. Remember Friedman's words: deficits are just indirect taxes (or something to that effect). Another Friedmanism: if tax cuts result in increased revenues to the Treasury you haven't cut taxes enough. Bingo! Tax less, spend less, stable currency. Then we'll REALLY see what prosperity looks like. It would shock even Mr. Dawg.
Grechster
The primary growth boost to the economy from a tax cut is in the first year (2018) so it is meaningful that tax revenues did not keep up with inflation in 2018. In future years the increased deficits will not have the offset of slightly faster economic growth, and the deficit spending adds up over time. More debt = higher interest payments, all other things equal.
The most important aspect of deficit spending is that it allows government spending to grow with little obvious pain to the taxpayers.
The taxpayers are like children -- they want the government to spend money on them but don't want to pay higher taxes to finance that spending -- in fact, they always want lower taxes ... so smarmy politicians (like Bush, Obama and Trump) give them what they want -- more spending and lower taxes (= more debt = more interest to be paid forever after = less money left for other government spending.)
,
.
.
Concerning the claims for record low unemployment split by "race", which I disagree with.
The first problem, and a big one, is Hispanic / Latino is not a race, and as far as I can tell, Hispanic data collection started in either 2007 or 2008. White data go back to 1954, black data go back to 1971, asian data go back to 2000 -- those are the three races. I have no idea how mixed race people are sorted. I don't know if Hispanic/Latino were all included as White before 2007/2008. In summary the data can not be trusted before 2007/2008 because the data collection methodology changed -- at least I can't find Hispanic data before then
(Here was my primary source: https://www.bls.gov/webapps/legacy/cpsatab2.htm
Take away from all the financial blogs and most so called pundits "Even though our Capitalist system made us the strongest country in the world, there is a deep seated hatred for those capitalist that have been wildly successful." i.e. President Trump.
Post a Comment