


Chart #1

The top portion of Chart #1 is the standard way to display the status of the Treasury yield curve. It represents the difference between the two lines on the bottom portion: the difference or "spread" between 10-yr and 2-yr Treasury yields. The spread is effectively a measure of the slope of the yield curve, which indeed is relatively flat compared to where it was several years ago. But it's not flat nor is it inverted; it is still positively-sloped, and that means the market believes the Fed is justified in saying it plans to increase rates modestly over the next year or so. The relative flatness of the yield curve is not saying that the Fed is tightening too much or threatening growth, it's best characterized as the market's way of saying that economic growth expectations are neither exciting nor worrisome. I explain this a bit more below.
Chart #2

Chart #2 is another way of looking at the yield curve—a better way, since it gives us some important additional information. The red line in Chart #2 is similar to the blue line in Chart #1, but the blue line in Chart #2 is the important addition: it shows the real, inflation-adjusted Fed funds rate, which is the overnight rate that the Fed targets. The Fed these days has absolute control over the nominal funds rate, while the rest of the nominal yield curve is essentially a projection of what the market thinks the funds rate will average over time. Any yield curve analysis worth its salt should measure not only the slope of the Treasury curve, but also consider the level of the real Fed funds rate.
The Fed doesn't just target the funds rate. What it really targets—but rarely talks about—is the real funds rate. Borrowing money at 5% when inflation is 1% is one thing, but borrowing money at 5% when inflation is 10% is quite another (the former means borrowing is expensive, the latter means borrowing money is a good way to make money). Real borrowing costs are what truly affect behavior. When money is very expensive—when real borrowing costs are high—people are discouraged from borrowing and spending and are encouraged to save money; eventually, if real rates are forced too high, economic activity suffers. That's been the proximate cause of every one of the recessions in the past 60 years.
One thing that stands out in Chart #2 is that the real funds rate has been negative for the past decade. Doomsayers think this means the Fed has been flooding the world with money, and the sky will soon be falling. Monetarists reason that, since we have seen neither a collapse of the dollar nor soaring inflation over the past decade, this can only mean one thing: the demand for short-term financial assets has been incredibly strong for many years (another way of saying that the market has been very risk averse for most of the past decade), and, moreover, the Fed hasn't artificially depressed interest rates, nor has it flooded the market with money no one wanted. The Fed has kept rates low because the demand for money has been strong. See this post (The Fed is not "printing money") from five years ago for more background.
Chart #2 actually has two messages: 1) an inverted yield curve is a good leading indicator of a recession, and 2) very high real short-term interest rates are also a good leading indicator of a recession. When both those conditions hold, that's when you need to worry about a recession. Today we're not even close to having to worry. Despite the Fed having raised its target funds rate six times in the past 18 months (from 0.25% to today's 1.75%), the real funds rate is still in negative territory (-0.18% as of March 31 by my calculations), because inflation over the past year has been almost 2%. The Fed has raised its target for the real funds rate because the market has grown less risk-averse and economic growth expectations have improved somewhat. The Fed hasn't "tightened" in the sense that it is trying to slow things down. The Fed is just following the market.
Chart #3
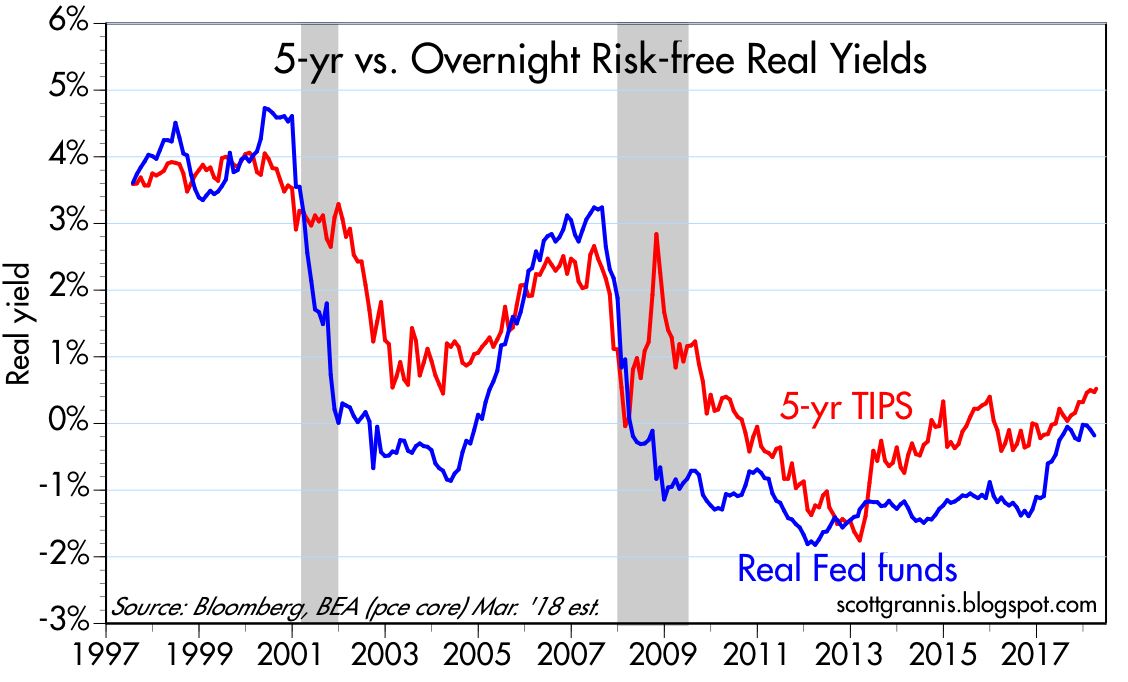
Chart #3 is important because it gives us information about the slope of the real, inflation-adjusted yield curve. Real yields are just as important, if not more so, than nominal yields. The blue line, the real funds rate, is ground zero for the real yield curve, while the red line, the real yield on 5-yr TIPS, is the market's estimate for what the real Fed funds rate will average over the next 5 years. Today, the front end of the real yield curve is positively sloped (i.e., the spread between the two lines is positive), and it has actually been steepening since last summer. The message: the market agrees with the Fed that short-term interest rates, in real terms, will need to rise in coming years. Not by a whole lot, but by enough to rule out the notion that the market and/or the Fed are nervous about the health of the economy. The time to worry is when the real yield curve becomes negatively-sloped, as happened before each of the past two recessions (i.e., when the blue line exceeds the red line, because that means the Fed has tightened too much).
Another reason the Fed needs to raise real rates is to boost the attractiveness of the $2 trillion of excess bank reserves held by the banking system. Failing to do so would decrease banks' desire to hold excess reserves, and that in turn would lead to excessive lending, too much money, a weaker dollar, and rising inflation.
Chart #4

Chart #5

Chart #6
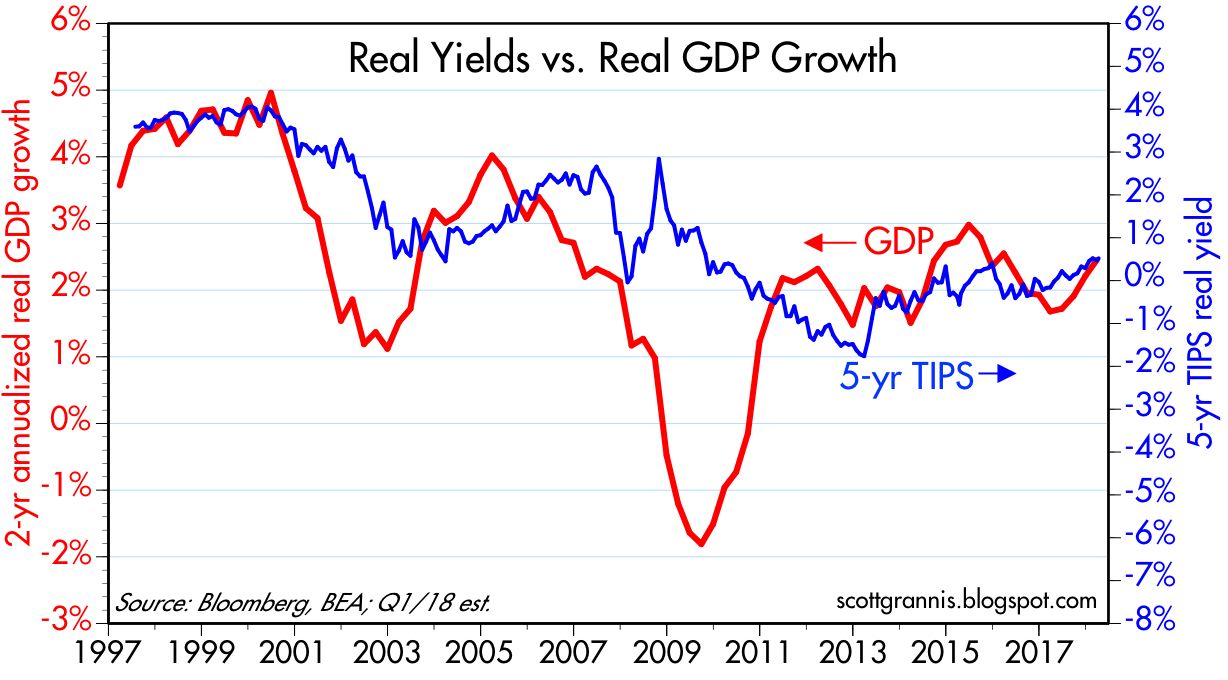
Chart #6 shows that real yields on TIPS also provide us with information about the market's GDP growth expectations. The level of real yields tends to track the level of real growth, and that is not surprising at all. A stronger economy implies higher real returns, and real yields should therefore rise in a faster-growing economy. Conversely, as economic growth weakens, as it did following 2000, real yields should fall. Currently, real yields of about 0.5% on 5-yr TIPS tell us that the market expects the economy is likely to grow about 2-2.5% per year, according to my reading of the bond market tea leaves.
If last year's tax reform results in a significant increase in economic growth, as I expect it will, then the Fed is going to have to guide real yields significantly higher as well. And that of course means significantly higher nominal yields, assuming inflation expectations remain "contained."
But for the time being, today's yield curve holds no threatening messages for the economy, and I think the market intuitively understands this.
What's worrisome today is not the yield curve, but the threat of a possible trade war with China and the ongoing tensions in the Middle East. The volatility that we are seeing is the result of the turbulence one would expect when headwinds (trade war risk, Middle East tensions) collide with tailwinds (last year's tax reform). For now, the market's judgment is that the two opposing forces effectively neutralize each other, with the result that growth is expected to be unimpressive, while inflation is expected to remain in the neighborhood of 2%.
16 comments:
Thanks Scott for another great analysis.
Found myself agreeing with everything posted.
Both logical and reasonable.
What's more worrisome is that we have a megalomaniac as POTUS who cannot accept any criticism. Just a matter of time before he does something exceptionally stupid...
Thank you, Scott. I love these charts and appreciate the commentary.
I do think, though, that there are additional worries beyond a possible trade war and the turbulence in the Mid East.
Chart #3, I think, is critical. And I'd just point out that if the real Fed Funds rate ticks up about 50 bps from here without any increase in the TIPS spread, we're into some very dicey territory. As it turns out, the Fed Funds futures market is predicting two more hikes this year and a decent chance for a third. It's also plausible that the TIPS spread stays stagnant... All this gets to Powell's determination to raise rates as part of a pre-set plan. So far, and I know it's early days, I think we're right to be a little concerned. Also, why is the Fed so committed to reducing its balance sheet? I thought from the get go that when it came time to reduce that we'd just let the securities run off. Why not? Why this irrational (in my opinion) fear of inflation a) given recent history, and b) given the fact that the Fed can prevent significant inflation by simply raising the IOER, a tool it didn't have in prior decades? Finally, I'd love to hear from Powell why HE thinks the yield curve has flattened so much. Such commentary might be telling, but we're all left to wonder. That, itself, is concerning.
Here is an excerpt from last MS call."Real rates aren’t yet in restrictive territory. On our current path for core PCE inflation and Fed policy actions, real rates will be about 25 basis points above neutral by March 2019 and about 45 basis points above by mid-2019. In the last two cycles, they rose meaningfully above neutral (to 2% in September 2000 and 1.9% in June 2007) before the business cycle ended 2-3 quarters later.
Bottom line: While there are clear signs that we are in the late-cycle phase, some time remains before we near the end of the business cycle. Hence, we think that global growth should be sustained at around a 3.8%Q SAAR over the next four quarters.
What is the rationale for excluding energy from the CPI? For working stiffs, the expense is significant, and it has been rising.
John, re the rationale for ex-energy CPI: For me, it's quite simple: energy is by far the most volatile component of the CPI. Over long periods (say, 15 years), inflation as measured by the total CPI index and the ex-energy index is almost identical. All that volatility washes out with the passage of time. The ex-energy version of the CPI gives you, I would argue, a better sense of the underlying trend of inflation.
Mark Perry (with help from MF, THE greatest economist of all time) hits it on the head with this post.
https://fee.org/articles/milton-friedman-the-way-we-talk-about-trade-confuses-the-issue/?utm_source=FEE+Email+Subscriber+List&utm_campaign=6b12ddc26a-MC_FEE_DAILY_2018_04_09&utm_medium=email&utm_term=0_84cc8d089b-6b12ddc26a-108016577
Of course, our moron POTUS and his minions are clueless. I grow more and more pessimistic with each day and that is NOT my normal modis operandi.
Scott - this is your best post yet in my humble opinion - I am a consumer analyst and the real time data I track for restaurants / apparel retailers / spring home building season etc are all very strong / accelerating - makes sense given tax stimulus / very high levels of consumer confidence which is helping release some animal spirits - the regional casinos i visit are humming as well - all of this is happening despite some of the worst weather possible (unseasonably cold for apparel etc) - so long story short the economy is humming and actually picking up momentum - I’ve tracked this for 20 years and it’s usually a good pulse for the overall economy - I agree with you that it makes a lot of sense to be optimistic and I think your read on the tarrif dance is proving spot on thus far - the market has chopped through a lot of negativity - my biggest near term concern is trump firing Rosenstein but that’s probably not going to derail much - regardless just wanted to share my lens - really appreciate and enjoy your blog - talk soon - Cameron
On economic matters, yours is consistently the most interesting, sensible and informative post available on the Internet. Thank you.
Thanks to all for the words of encouragement.
{In order to provide more liquidity to the banking system, the Fed needed to expand its balance sheet by buying Treasuries and mortgage-backed securities.
“The only way we could do that was to expand the reserve deposits the banks held with us,” said David Wheelock, St. Louis Fed group vice president and deputy director of research. “It was necessary to pay interest on those deposits in order to avoid excessive money growth solely as a result of the temporary injection of liquidity into the banking system during the financial crisis.”}
Which is what Scott has been saying for years. https://www.stlouisfed.org/open-vault/2018/april/why-fed-pays-interest-banks-reserves
Another great wrap-up by Scott Grannis.
I remain concerned about $1 trillion federal deficits to the moon and back, but "la-de-dah" seems to be the present mood. The market is relaxed.
I wonder if banks would lend out reserves even without much in the way of Fed-bank paid interest on reserves. Banks will only loan when they think they will get their money back with interest. But C&I lending is beginning to slow. In terms of production, the housing market never recovered.
As an aside, perhaps I am too cynical, but I would not be be the first to posit if you give a government entity the power to regulate, soon it will be regulating on behalf for the regulated, not the general public or macroeconomic interest. That is called regulatory capture.
This Fed-financed interest on reserves may size up well for banks in the next couple of years. The Fed will be helping them make money, perhaps even "hold ransom" their pile of reserves. Could lead to wider spreads for banks and some thick profits.
Perhaps mitigating concerns about the federal debt is the Bank of Japan, and the fact it has bought back 45% of JGBs and they are around 1% inflation, with very low unemployment. The BoJ pays negative interest rates on reserves. Frankly, this mystifies me, but certainly a central bank can buy back national debt without inflationary consequence. That is a matter of historical record.
The Swiss central bank printed up $900 billion (about $90,000 per Swiss resident) and bought foreign bonds, to keep the exchange rate of the Swiss franc down. This has not resulted in inflation.
That is the great thing about macroeconomics: no one is ever wrong.
Macroeconomics has been a hobby of mine for decades, but I think maybe it is time to try gardening.
Add on: while wars are always humanitarian disasters, I do not think the Syrian conflict will emerge into something with a macroeconomic impact in the US.
Iraq and Afghanistan drained trillions of dollars out of our private sector but those wars are largely over, and Trump seems at least somewhat true to his non-interventionist creed.
On China trade, the fearmongers have run wild. Maybe the importers and the Chinese mercantilists are running a PR campaign. But in fact, both Reagan and Nixon were much larger protectionist than Trump and the US economy prospered.
Benjamin
a) US just bombed Syria -- based on what appears to be faulty information (about gas attack)
b) POTUS looks at GB(jr) as a role model to get good results in 2020 -- nothing like a good war to get better rating
c) Comparing today's world economic order with what was in place 30 years...I get that Reagan is the hero of the right, still, it comparing apples and oranges.
d) Moreover, don't discount two trends -- a likely hostile Congress in 2019 and the Mueller investigation
Aside from that, you've all got to admit that the right move for investors is to buy the rumor (pre-tax cut days) and sell the news. Banks are doing gangbuster profits -- that should tell you all you need to know about where the money is going, a hint it's not higher private wages.
Frozen:
Right you are, bank profits are to the moon. Corporate profits in general are very, very strong. These are the good old days for corporate profits, now at record relative and absolute zeniths, far eclipsing anything that ever happened in the Reagan era. This is great news, even though it receives little press coverage.
I do hope the next leg of economic growth includes lots of real wage gains. If we want voters and workers to believe in free enterprise then solid wage gains are a prerequisite.
Let us hold hands and bow our heads to relevant deities that the US does not get involved in another major and useless war.
EU is weakening
https://www.ft.com/content/b5358702-3d7d-11e8-b7e0-52972418fec4
Post a Comment