


I've long argued that real yields on 5-yr TIPS were a good indicator of the market's expectation for the trend of real economic growth. As the chart above shows, the two tend to track each other over time. Real yields on 5-yr TIPS have moved quite a bit higher over the past two years, and now we discover that the economy strengthened over that same period. The annualized rate of economic growth over the past two years was 2.7%, a good deal better than the 2.2% annualized growth since the recovery started in mid-2009. .

Despite the pickup in growth, however, the economy is still a lot smaller than it could/should have been. As the chart above shows, the shortfall in growth relative to long-term trends is about $2.8 trillion. Per year. We're talking about a lot of income that's being left on the table, and a lot of people unemployed or underemployed, most likely because of higher tax and regulatory burdens.
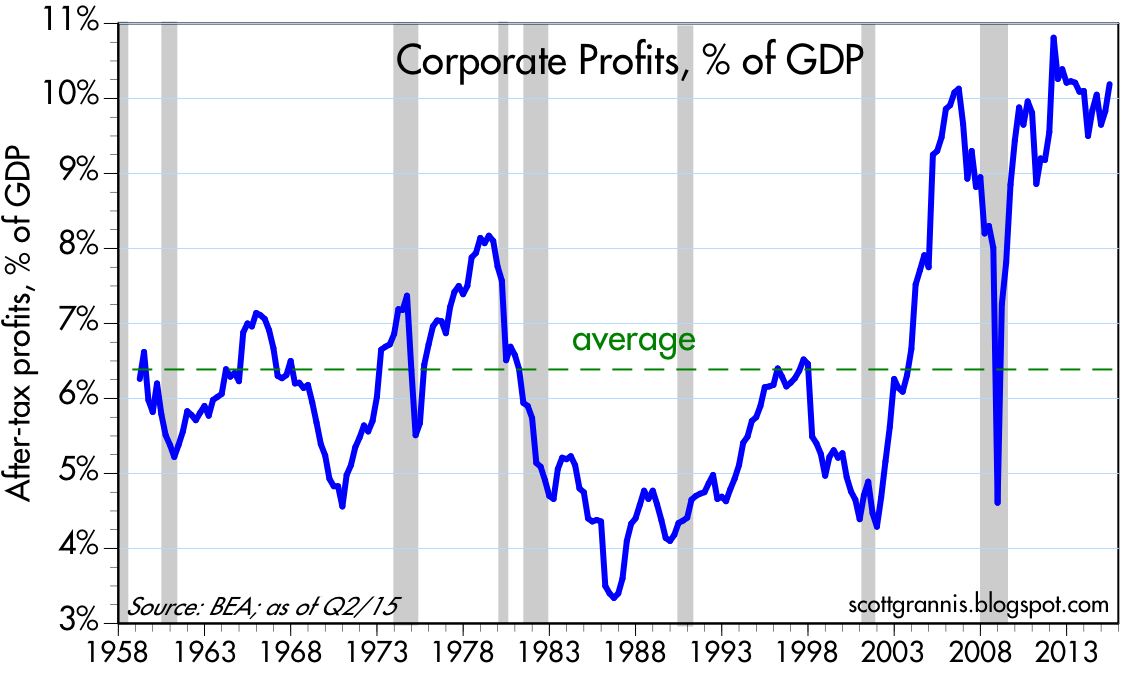
Yesterday's GDP revisions also gave us the first look at corporate profits after tax for the second quarter. They reached a new nominal high of $1.82 trillion. As the chart above shows, that puts corporate profits very close to an all-time high relative to GDP. From a long-term historical perspective, corporate profits have been exceptionally strong throughout the current business cycle expansion.

The chart above shows the PE ratio of the S&P 500 using the after-tax corporate profits (with adjustments for inventory valuation and capital consumption allowances and normalized in order to facilitate comparisons to reported PE ratios) as the "E" instead of trailing GAAP earnings. By this measure, the stock market at the end of June was trading very close to its long-term average valuation.
What does all this say? The economy is doing OK, and has even managed to improve somewhat in recent years, despite all the moaning and groaning. Corporate profits have been absolutely fabulous, and certainly supportive of higher equity prices. Stocks aren't in a bubble, and monetary policy hasn't stimulated the economy or caused equity prices to artificially inflate.
So why is the market so worried? Why is the Fed so worried about the economy that they have to keep interest rates at zero? Sure, things could be a lot better, but we're not talking about a fragile economy that needs an extraordinary dose of TLC (aka low interest rates) to survive. If we want things to improve, we need to look to fiscal policy, not the Fed.
11 comments:
"What does all this say? The economy is doing OK, and has even managed to improve somewhat in recent years, despite all the moaning and groaning. Corporate profits have been absolutely fabulous, and certainly supportive of higher equity prices. Stocks aren't in a bubble, and monetary policy hasn't stimulated the economy or caused equity prices to artificially inflate."
This would certainly mean to limit the declines in the indexes..Yes, 1% growth for
the quarter was excellent, indeed so it should limit any damage to the market for interim.
As for fiscal policy and actions from the FRB, expect the status quo and don't expect
either to make serious changes..These are tepid institutions.
Scott,
From time to time you post the P/E ratios of the S&P 500 using NIPA earnings and as calculated by Bloomberg. My understanding is that Bloomberg uses some version of trailing twelve month announced earnings. I don't have a Bloomberg machine so I don't have access to the data or exactly how they calculate it. When I back in to the EPS number from the index value and the published PE it seems to bounce around. I find it useful that you use consistent charts (i.e. S&P 500 PE from Bloomberg) over time and would like to understand it better. Thanks and keep up the good work. Your explanations of complex events and issues are easy to understand.
china can't pull off the holy trinity; yuan devaluation coming in size when the fx reserves get burned beyond a cushion. they we'll come back and review all this cheerleading.
Re China: If the central bank tries too hard to offset its sale of Treasuries (which shrink the Chinese monetary base) by fiddling (e.g., bu lowering reserve requirements) then things could get dicey; so far there offsetting moves seem fairly modest. As I noted in my recent post (A tale of two currencies), sales of Treasuries help restore the supply and demand for money because they reduce the Chinese money supply at a time when the market's demand for Chinese money is declining. It's an automatic stabilizer or sorts. But attempts to offset this with moves to expand money via other methods are potentially doomed to failure. Indeed, they cannot do everything with monetary policy.
But if they do things right, a decline in reserves and a weaker yuan should restore equilbrium with a weaker but still-growing economy as a result.
I see them selling more reserves and lowering the peg further, but not significantly.
Dude: I don't know exactly how Bloomberg calculates PE ratios, but I know they use trailing 12-month earnings (which is standard) and I know they adjust those earnings, presumably to take out one-time factors and perhaps other things. Regardless, they follow a consistent methodology which, as you note, is important.
Interestingly, the message of both methods of calculating PE ratios (mine, which uses NIPA after-tax profits, and Bloomberg's, which uses trailing 12-month adjusted earnings), are saying almost exactly the same thing: PE ratios today are only modestly above their long-term average. I find that to be very attractive, considering that NIPA profits (which are more inclusive and arguably more accurate than reported earnings) are close to record highs relative to GDP.
The corporate profits story is wonderful---proof that the private-sector produces, becomes more efficient constantly.
Gadzooks, we need to cut federal agency spending. Cut "national security" (i.e., military-VA patronage) in half, and then eliminate the USDA, HUD, Labor and Commerce Departments.
The Fed? Inflation is about half of target and the economy $2.3 trillion below full output. Really, the Fed should hire some B-52s and bomb America with Benjamin Franklins. I wish we printed a larger denomination.
I cannot understand the current squeamish prissiness about moderate inflation of inflation. Egads, give me Full Tilt Boogie Boom Times in Fat City and 4% inflation for the next 20 years.
As we have seen, the private-sector will suck up it and produce it out.
Re cutting government spending: the only way to make meaningful cuts in federal government spending is to attack transfer payments. They now total $2.7 trillion and represent fully 70% of federal spending. As engineers like to say, "find the high nail." Transfer payments are like a cancer on the body politic. They must be reined in.
Social Insecurity and Medicare should have been removed from the control
of CONgress and become non-profits..But these programs are used by members
to grease the squeekie wheels. Another two prime examples of the monumental
failure of CONgress, are both the post office and Amtrak.
And what you rein in, can be reined out..The only solution is complete separation
or a divorce from the status quo parties..Rest assured, there will be no blood,
sweat, or tears until economic forces take COMPLETE control and these spineless
man and women are forced to act..Set your clocks and calendar to 2025 - 2030.
Ben Jamin, your calls for continues reduction in military spending is coming to
an end..The cost to the War Department is 2/3 in past and present personnel
wages and benefits..
The volunteer army, another thoughtless idea from the bankrupt halls of CONgress.
By 2034 is the estimate when personnel costs will be so high, that all you will be
left with is the Pentagone..Perhaps by that time, they will have invented the virtual army,
mechanical soldiers, programmed by Microsoft and powered with Telsa batteries.
...all the moaning and groaning...
LOL.
peg can't last w slowing economy/rr reduction to stimulate and capital flight.
Scott - I could not agree with your assessment of the US economic picture. Think the dollar is likely to strengthen with continued US strength and coming growth in exports of energy and petrochemicals. However, what happens if China does go into a recession or slows down significantly? Chinese overcapacity is turning many companies into debt servicing companies like the shale companies are becoming in US.
The Commodity bubble bust has cut down on the imports by commodity export countries but their exports have not picked up. Will this not be felt by Germany, Japan and Korea - export heavy countries?
Please opine sir.
Post a Comment