


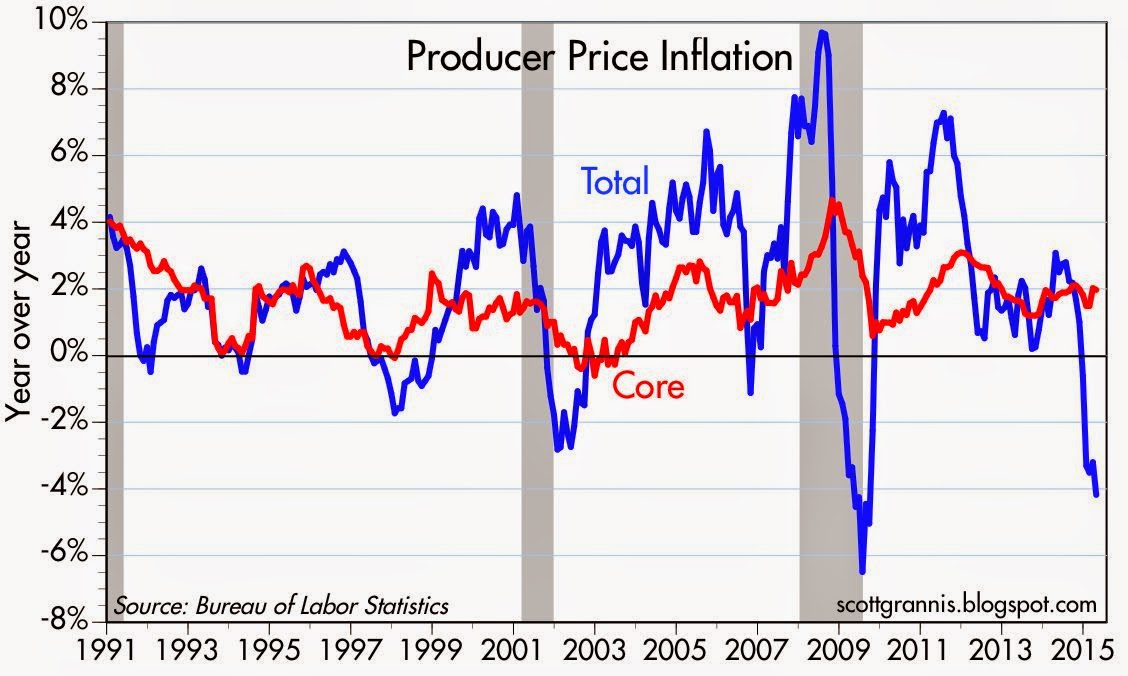
The chart above focuses on the total and core measures of the traditional version of the PPI (in recent years the BLS has begun releasing a new version called "final demand" which show inflation by both measures to be lower, but I'm sticking with the "finished goods" version that goes back decades for its historical value). Here we see how oil prices have introduced a huge amount of volatility to the total PPI. We also see that the core PPI has been running around 2% for quite some time. In fact, over the past 20 years, the annualized rate of increase in the core PPI has been 1.6%. We're not in some "new normal" world—when it comes to inflation, nothing much has changed for the past two decades.

The chart above subtracts the core PPI from the yield on 10-yr Treasuries. Here we seen that real interest rates today are back to the levels of the late 1970s. There has been a steady decline in real interest rates ever since the early 1980s. When real interest rates are zero or less, using leverage to buy things begins to become very attractive. It's not surprising therefore that there is a growing body of evidence that bank lending is picking up.

As the chart above shows, the growth of bank credit has been accelerating since early last year. Over the past six months, Total Bank Credit is up at a 10% annualized pace.
Now is not the time to worry about deflation. The Fed should begin to normalize interest rates to avoid excessive borrowing and rising inflation.
7 comments:
Well...the Atlanta Fed just forecast Q2 real GDP growth at 0.7%...Q1 was probably flat...raise rates?
The Fed will be forced back to QE...the question is how much economic damage will the US economy have to endure before then?
I have two friendly criticisms:
1) I think your connection between low rates and risk-taking leverage may be an example of Scott Sumner's "reasoning from a price change". I would suggest that low risk-free interest rates are a sign of risk aversion, if anything.
2) Your 6.1% bank credit growth trend line is set below all the actual bank credit levels in the graph. And a move above that trend is what you are noting in your call for a rate hike. Do you really want a forward trend that reflects the worst credit crisis in decades? Wouldn't you want to hit a trend going forward that reflected good economic times?
Kevin: I think you've misunderstood my position. I absolutely agree that very low risk-free rates are a sign of risk aversion. That's been the case for years. But I think risk-aversion is now declining on the margin, and that is why bank credit growth is picking up. The point of the trend line is simply to show that after years of very slow growth, bank credit is now growing at a much faster rate.
With more and more signs of declining risk aversion, the rationale for a Fed rate hike gets stronger.
2yr-10yr and 10yr-30yr curve spreads also seem to be indicating a pick up in inflation expectations, I have to admit I'm a little skeptical and think that the 10,000+ baby boomers retiring every day for the next 15 years will put a damper on demand and inflation, but that thought is certainly being tested at the moment. I still don't see what effect the raising of the rate the Fed pays on reserves does to the demand or supply for money (although it will obviously raise fed funds to 50bps, but it sure seems like a pretty ham handed way of doing it.
Scott my other question is: can the growth in C&I loans be broken down into the C component vs the I component? I'm not sure growth in the C component tells us much other than risk aversion in the commercial sector in shrinking rapidly. Personally I don't find that very comforting.
steve: retiring baby boomers could become a source of deflation only if their demand for money exceeds the Fed's willingness to supply it.
Raising the rate the Fed pays on reserves should increase banks' willingness to hold on to excess reserves, and thus limit their ability to increase lending. But so far that's just a a theory that hasn't yet been proven in practice. There's the rub...
steve: I haven't seen a breakdown in C&I Loans. But the pickup in bank lending that is being driven by declining demand for money is not exactly comforting, especially if the Fed is slow to react.
Post a Comment