Tuesday, August 24, 2010
The stock/corporate bond disconnect
This chart compares the S&P 500 index with the price of HYG (a large high-yield index bond fund). The correlation of these two prices was an impressive 0.95 throughout the second half of last year. The correlation has since dropped to 0.67 over the course of this year, and in the past two months (since mid-June) the divergence has become noticeable: bond prices have tracked higher as equities have weakened (see chart below for a detailed look). Only a part of that divergence can be attributed to falling yields on government bonds—most of the divergence is explained by a tightening of corporate spreads which began in June.
This means that in the past two months the equity market has grown more pessimistic about the outlook for corporate earnings while the bond market has grown more optimistic about the outlook for corporate defaults. This is, to put it mildly, a curious development, since normally the outlook for earnings tracks the outlook for defaults quite closely.
How to explain this? Perhaps the equity market is too pessimistic, or the bond market is too optimistic. An optimistic interpretation, to which I'm partial given my bond-market background and experience, would say that the bond market is the leading indicator, especially at key turning points. There have indeed been times in the past when the bond market has led the stock market. For example, corporate bond spreads started tightening in earnest in the last two months of 2002, while the equity rally only really got underway several months later. Then, corporate bonds spreads (and in particular swap spreads) started widening in early 2007, but equities didn't start falling until much later that year.
I think this all adds up to one more reason to think that the equity market is much too gloomy these days. Earnings have been growing strongly, and there are plenty of signs that suggest that the economy is not falling into the double-dip recession so many seem to be calling for these days.
Why deflation is not in the cards
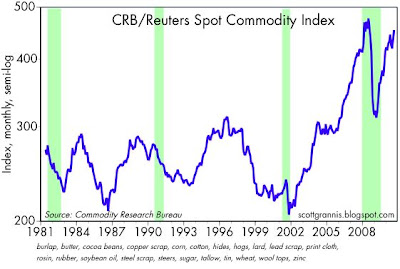
Deflation is when all prices fall relative to the unit of account—when the value of the unit of account rises relative to the prices of all goods and services. That is most certainly not the case today, as these three charts make clear.
Gold has risen steadily for the past 9 years against the dollar. Spot industrial commodity prices are only inches from making new all-time highs. And the dollar is very close to its lowest levels ever against a large basket of foreign currencies—which of course means that prices in other countries are historically high relative to our prices.
All you can reasonably say about prices today is that some prices are falling while many other prices are rising. We are seeing a lot of relative price changes, but we are definitely NOT seeing all prices decline. It is almost inconceivable that we could be on the cusp of an actual deflation when commodity and gold prices are soaring and the dollar is very weak against other currencies.
The closest we have been to an outright deflation was in the 2002-2003 period, and that's when the Fed first panicked at the prospect of deflation. Leading up to that period, we saw gold and commodity prices plunge, and the dollar soar against all other currencies. And the proximate cause of all that was a period of extremely tight monetary policy from 1995-2000. Today we have the exact opposite set of conditions. This is not a deflation.
Monday, August 23, 2010
The Bush/Obama $4.4 trillion spending boom

From today's WSJ:
CBO's mid-year review largely reinforces the bad news we already knew—to wit, that spending has exploded since Democrats took over Congress in 2007, first with the acquiescence of George W. Bush and then into hyperdrive after Mr. Obama entered the White House.
To appreciate the magnitude of this spending blowout, compare CBO's budget "baseline" estimate in January 2008 with the baseline it released Thursday. The baseline predicts future spending based on the law at the time. As the nearby chart shows, in a mere 31 months Congress has added more than $4.4 trillion to the 10-year spending baseline. The 2008 and 2009 numbers are actual spending, the others are estimates. As recently as 2005, totalfederal spending was only $2.47 trillion.
This is the biggest problem facing our economy today: the huge and escalating increase in the size of government intervention in the economy. This is unsustainable, and I predict will not be sustained. The voters are sick and tired of this; the public sector at all levels of the economy is getting out of control, and it must be reined it. Stop the spending!!
Subscribe to:
Posts (Atom)


