Monday, March 23, 2020

Chart updates

Stocks made new lows today, but fear is receding. So far, my guess that last Thursday marked the worst of the crash seems to be holding up. The Vix has peaked, but stocks have yet to bottom, which calls to mind what happened in the 2008-9 period, when the Vix peaked months before stocks bottomed. I'd like to think th. On the margin, things continue to improve. The news has become less bad: there are now quite a few therapeutic drugs available, testing is rapidly ramping up in the US, Italy's new daily cases appear to be declining, the US shutdown has been extensive (and painful), mortality rates are trending lower than feared, the Fed has pulled out all the stops, and Congress will likely soon approve a massive and reasonably-effective stimulus and aid package.

Chart #1

In Chart #1 we see that the Vix hit a peak of 80+ last Thursday, whereas stocks have fallen further since then, This is not an all-clear signal, but it is somewhat reassuring. Panic is subsiding, and concrete solutions are being implemented.

Chart #2 

Charts #2-4 show what is arguably the best measure of equity market capitalization. Note that this calculation comes from Bloomberg, and it excludes ETFs and ADRs in order to avoid double-counting (it is also in dollar terms). Note also that although the current crash has been extremely rapid and steep, it is still noticeably less, on a percentage basis, than the financial market disaster of 2008-2009. Back then the world feared the collapse of global financial markets and a global depression. At one point in late 2008, one Wall St. firm calculated that credit spreads were priced to the expectation that something like 25-30% of all US corporations would be out of business within a few years. We are NOT talking about that kind of destruction this time, thank goodness. This virus is almost certainly not going to wipe out a huge chunk of the world's population.

Chart #3

Chart #4

UPDATE: I highly recommend this letter from the Association of American Physicians & Surgeons to President Trump, dated March 21st. Very impressive and encouraging!

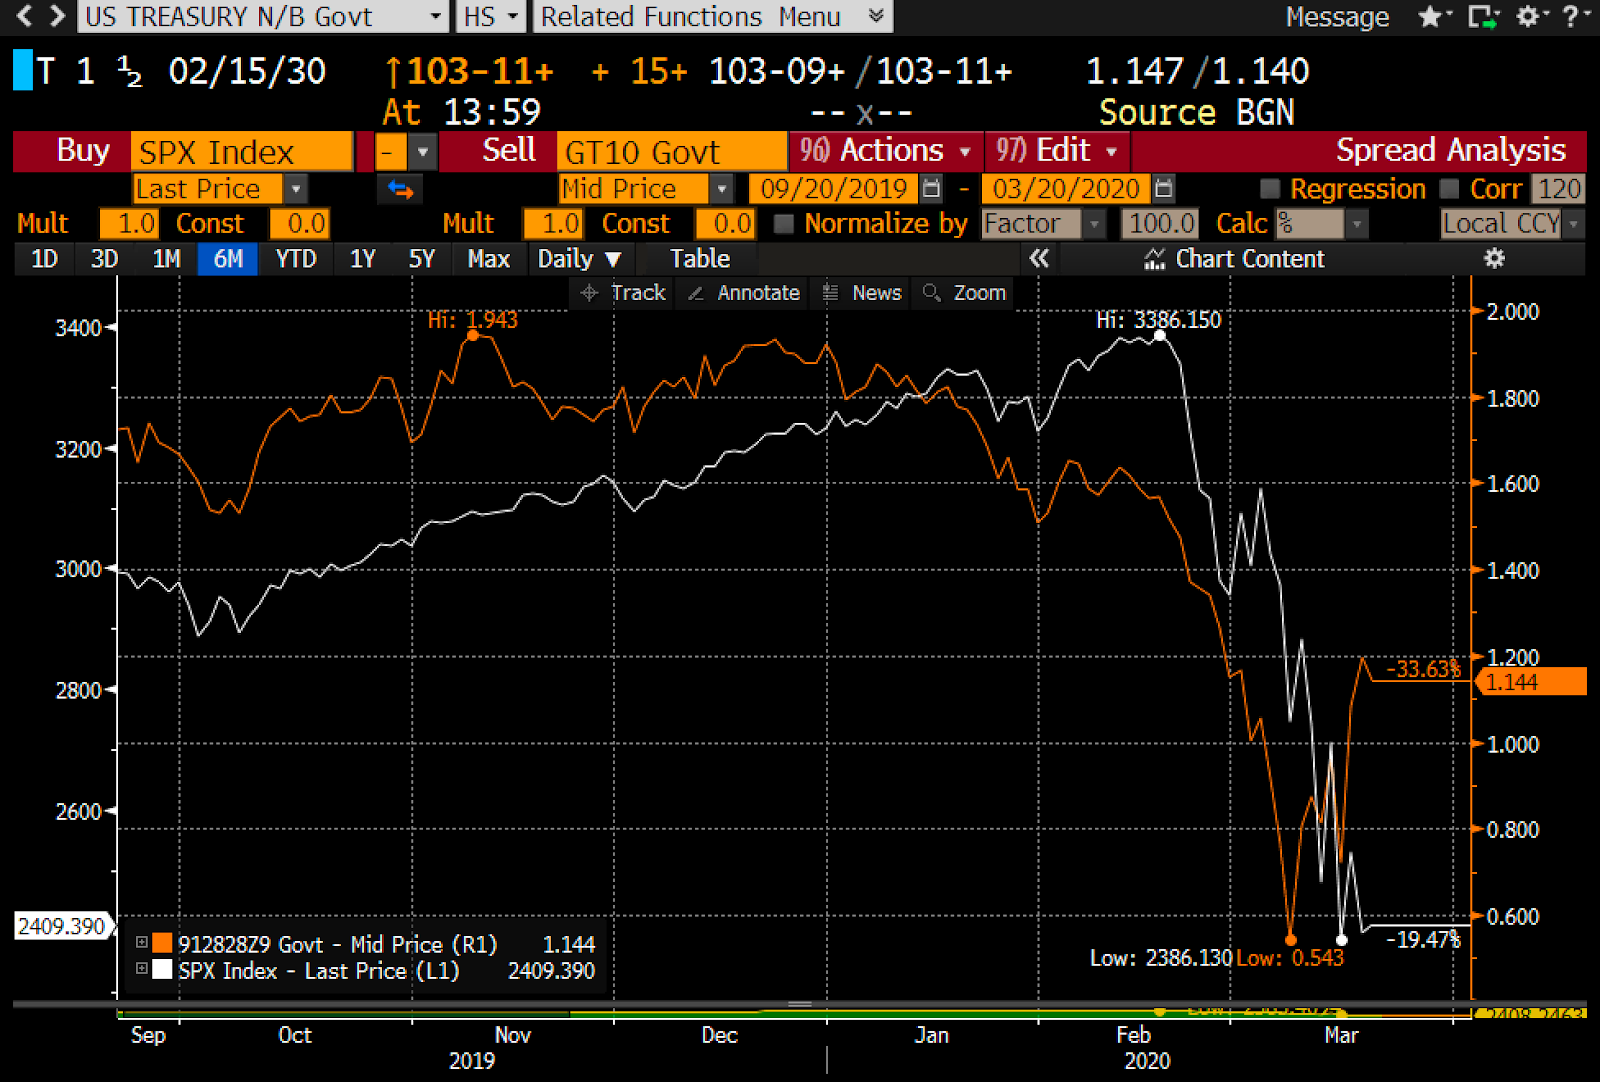
UPDATE: as of 12:30 EDT. My forecast above that "we'll see the bottom in stocks sometime in the near future" looks to be coming true just two days later. Here's an updated chart:

Chart #5


Thursday, March 19, 2020

We've probably seen the worst

My sense is that yesterday marked the extremes of panic, despair, capitulation, short-covering, and anguish.

As emotions cool, even as covid-19 cases soar and deaths rise, we are beginning to see the light at the end of this tunnel. There are several drugs that are now available as therapeutics, thanks to Trump twisting the reluctant FDA's arm. Trump knows, and everyone does also, that maximum pressure needs to be applied to the Saudis and the Russians to encourage them to end their mutually-destructive crude oil price war. Even as Italian virus cases soar and mortality rates exceed what happened in China, the numbers in the rest of the world are becoming more realistic. High fatality rates appear to reliably coincide with colder climates, older and sicker populations (99% of the Italians who died from covid-19 deaths had at least one other infirmity or illness!), populations with high rates of smoking, and populations with centralized healthcare systems. Mortality rates in Germany, the US, Germany, Japan, France, the UK, Canada, Australia, Switzerland, So. Korea, and Singapore are much lower. All mortality rates are most likely overstated in any case, since it appears that only about half of those infected with coronavirus show symptoms, and those are the only ones that tend to be tested.

If nothing else, the extreme measures already adopted by most of the U.S. and the rest of the world will almost certainly result in a slower progression of contagions in the weeks to come. Testing kits—essential to effectively control the disease, but tragically lacking in most of the US until recently—are now being widely distributed.

I'm not saying this is the absolute bottom. The Vix index has probably hit its peak, but that doesn't guarantee that risk assets have hit their bottom. The Vix peaked in October of 2008 but the stock market didn't hit bottom until early March '09. Oil prices surged almost 25% today, but they remain extremely low. The dollar continues to march higher, and that puts pressure on all commodity prices and most emerging market economies.

But the anguish that permeated everything yesterday seems to have faded to an important degree today. On the margin, the news is no longer uniformly bad; there are pockets of relief and glimpses of improvement beginning to show up here and there.

Some relevant charts:

 Chart #1

 Chart #2

As Charts #1 and #2 show, the Vix index has reached a high that is just shy of the worst levels we saw at the height of the 2008 global financial crisis. Back then, many thought that we were on the edge of the abyss, about to witness the collapse of the entire global financial system, coupled with a global depression. Can a little tiny virus be worse than that? Chart #1 shows that the market has effectively given up the gains it registered over the past three years. Three years of record-setting profits, decent growth, rising prosperity, lower taxes, and record-low levels of unemployment—all for naught.

 Chart #3

Chart #3 highlights the price action of the S&P 500 over the past six months. It also shows (bottom bars) how trading volume has soared as prices have plunged. Record levels of panic, record levels of trading, and plunging prices are the hallmarks of a panic-driven market, and they are also typical of bottoms. Let's hope this is as bad as it gets.

 Chart #4

Chart #4 shows the spreads on high-yield, energy-sector bonds as of yesterday (Mar. 18th). We've never seen worse, and it is directly a function of the enormous decline in oil prices, which have created near- fatal conditions for most of the world's oil producers. But thanks to a 24% gain in oil prices today, we've probably seen the high-water mark for energy sector credit spreads. Importantly, Trump today announced that he is going to "apply pressure" to the Saudis and the Russians, in order to force them to cut their output.

 Chart #5

Chart #5 shows 10-yr Treasury yields (red line) and the level of the S&P 500 index (white line). It looks very much like Treasury yields have been leading the stock market. If that is indeed the case, the big jump in yields over the past several days suggests the stock market is likely to experience some welcome relief in the days to come. 10-yr yields have traditionally been a good barometer of the market's degree of confidence in the outlook for the economy. Most commentators will probably attribute the rise in Treasury yields to the market's expectation of huge federal deficits being funded to pay for fiscal "stimulus" plans. I have yet to see anyone of late come up with any fiscal plan that looks genuinely stimulative. Sending checks to everyone does nothing to change incentives to work or to keep idle workers on the payroll. I would get excited about a payroll tax holiday. In any event, it's just as likely that the market is reading the virus tea-leaves and concluding that the pandemic hype has been overblown.

 Chart #6

Chart #6 shows the spread between 10-yr and 30-yr Treasuries. Rising spreads are typical of economies that are growing and healthy. I think this chart reinforces the argument that the market is beginning to look across the valley of despair, and anticipating better times ahead.

 Chart #7

One troubling fact remains: the strong dollar. As Chart #8 shows, the strength and weakness of the dollar tends strongly to coincide with the ups and down of commodity prices. The dollar is now at an 8-year high, and commodity prices are uniformly weak. (Note that the dollar is plotted using an inverted scale.) That's bad news for emerging market economies, and it's even pulling down the price of gold—which is remarkable given all the bad news that's out there. For that matter, gold stands out among all commodities for its resistance to the strength of the dollar. Gold investors should be wary.

Wednesday, March 18, 2020

Recession + deflation = real panic

What's worse: a steep recession or falling prices? Answer: A steep recession AND falling prices. That's is the underlying reality that is shaking markets to the core right now. There are three factors which are creating those conditions: the coronavirus, government-ordered shutdowns, and a war between Saudi Arabia and Russia over oil production, and they are all inter-connected. We have to be getting very close to a resolution of this conflict, because the level of panic is rapidly approaching an intolerable extreme.

The news could hardly be worse. We're in the midst of a global pandemic that, apart from a handful of countries (China, S. Korea, Singapore) is spreading geometrically. Governments everywhere are ordering quarantines and outright shutdowns of activity. Global travel has collapsed, potentially bankrupting nearly every cruise ship and airline company. The entire restaurant industry is teetering on the edge of failure, and take-out is only a band-aid solution. Vaccines and therapeutics won't arrive for many months. Millions of people are being laid off. GDPs are sure to plunge at dizzying rates.

Bottom line: fear, uncertainty and doubt have reached epic heights. The market cap of global equity markets has plunged by over $30 trillion in just the last month. Nearly every major equity market is down between by 30-40% year to date, and some prices are plunging and surging at double-digit daily rates.

To continue on the present course—shutdowns, price wars—until the virus is vanquished is madness. Something has to give. Saudi and Russia need to declare a truce. Politicians need to call off the shutdowns: at some point the economic damage caused by shutdowns will greatly exceed the possible damage from the virus, which is already losing intensity thanks to shutdowns, hand-washing, and social distancing. The contagion curve is already beginning to flatten in Italy and Spain, and it can't be long before the U.S. also sees a slowing in the growth of new cases.

Yes, 8,000 people have died around the world as a result of the coronavirus in the past three months, but more than 20,000 people in the U.S. died last year of run-of-the-mill flu and no one sounded any alarm. Let's keep things in perspective, please.

When conditions become intolerable, as they are today, something's gotta break. And it will, soon.

Here's a look at the key variables impacting the markets today:

Chart #1

Chart #2

As Charts #1 and #2 show, fear has reached the same extreme as we saw at the height of the 2008 financial panic. Equity prices are down over 30%. It's a rout; everyone's headed for the exit. 

Chart #3

Chart #4

As Charts #3 and #4 show, plunging oil prices have caused inflation expectations to collapse. We are very close to the deflationary expectations that existed at the height of the 2008 panic. We are living in extreme times. No amount of QE will fix the virus threat, but QE will help the market cope with dislocations caused by extreme panic. The Fed needs to accommodate the market's need for safety and liquidy. Inflation is NOT a problem. Fiscal stimulus fueled by new Treasury issuance is NOT a problem and will directly help the consumer and small businesses to survive the (largely unnecessary in my opinion) government-mandated shutdowns.

Chart #5

Recession is now likely, and credit spreads agree, as shown in Chart #5.

Chart #6

As Chart #6 shows, it's plunging oil prices that are at the root of the credit market's concerns. High yield energy-related bond spreads (shown here as of yesterday) are most likely now at record-breaking levels, higher even than we saw at the height of the 2008 panic. Oil prices MUST stop falling; Saudi and Russia MUST call a truce. Both need to cut production dramatically, and SOON.

Chart #7

As Chart #7 shows, the prices of gold and TIPS are plunging. That's odd, because both are safe--haven assets. The explanation for their decline can be found in mounting deflation fears: who needs inflation protection if prices are falling? On the bright side, however, rising real yields on TIPS suggest that the market is beginning to look to the future and beginning to expect that fiscal and monetary stimulus—combined with a cessation of the oil price wars—will lead to a much stronger economy tomorrow. There IS light at the end of this dismal tunnel!

Chart #8

A marked steepening of the Treasury yield curve is also good news. The curve is steepening not because the Fed is easing, but because the market  sees better times ahead. And anyway, 10-yr yields are ONLY 1.25%, hardly a level to worry about. The Treasury has plenty of room to sell loads of bonds and at a very low cost. And they should.

Chart #9

Chart #9 shows one other problem that is plaguing markets today: a strong dollar (blue line). A strong dollar is the result of global panic, and it is also one source of deflationary pressure on all commodity prices. More QE, please, because the world wants and needs more dollars.