The Coronavirus (Covid-19) is spreading, and panic is spreading throughout global markets. Unfortunately, it's difficult to know whether this will be a true pandemic or just a panic. We'll know more before too long, but I was encouraged this morning to
read in a Reuters article that
Mainland China reported nine new coronavirus cases outside the epicenter of Hubei on Monday, the lowest since the national health authority started publishing nationwide daily figures on Jan. 20.
Several provinces have lowered their coronavirus emergency response measures, allowing more flexibility on transportation and helping firms resume production.
About 180 million workers have left their hometowns to return to work since Feb 10, when China ended the prolonged Lunar New Year holiday due to the virus outbreak, according to Reuters calculations based on transportation ministry data.
At the current daily travel flow rate of more than 14 million people, about 192 million people are likely to return to cities where they work during the last two weeks in February, beating a government projection of 120 million.
Nevertheless, it appears to be spreading rapidly in other parts of the globe.
One expert predicts that the virus "will ultimately not be containable." (HT: reader "Johnny Bee Dawg")
The following charts are my contribution to understanding the degree of panic that is priced into the market as of this morning. By some measures we have reached very high levels of panic, but not by others. Thus, I think the situation will remain in flux for awhile until we can better assess the degree to which the virus has spread outside of China and how lethal and it ends up being.
There is likely to be more downside risk before this is over. Whether that means you should sell now, consider what might happen if someone were to announce the availability of an anti-coronavirus vaccine and/or a way to reduce its severity. A reversal of today's panic pricing levels would almost certainly result in a huge market rally. Just
today we learned that "Drugmaker Moderna Inc. has shipped the first batch of its rapidly developed coronavirus vaccine to U.S. government researchers." It will be months, however, before we learn if the vaccine is indeed effective and safe to use.
Chart #1
Chart #1 compares gold prices to TIPS prices (using the inverse of their real yield as a proxy for their price). Both assets are what might be considered to be true "safe havens." Gold is a refuge against all sorts of evils, while TIPS are free of default risk and government-guaranteed to pay a given real rate of interest. Both prices have surged of late, but they are still short of the levels they reached some 8 years ago, when global markets were still reeling from the shock of the Great Recession and its global financial crisis.
Chart #2
Chart #2 shows how real yields on 5-yr TIPS tend to correspond to prevailing levels of real GDP growth. With the real yield currently trading at about -0.4%, the chart suggests that the market is priced to a substantial slowdown in US economic growth to something a bit below 2%. That's meaningful, but it's not yet disastrous. A virus is not likely to kill the US economy, but it could definitely slow down overall growth.
Chart #3
Chart #3 shows how panic attacks (spikes in the ratio of the Vix index to the level of 10-yr Treasury yields) almost always result in sharply lower equity prices. Today the ratio is much higher than it has been during other panic attacks which resulted in much bigger equity market sell-offs. The next three charts show the components of the ratio to better understand why it is so high today.
Chart #4
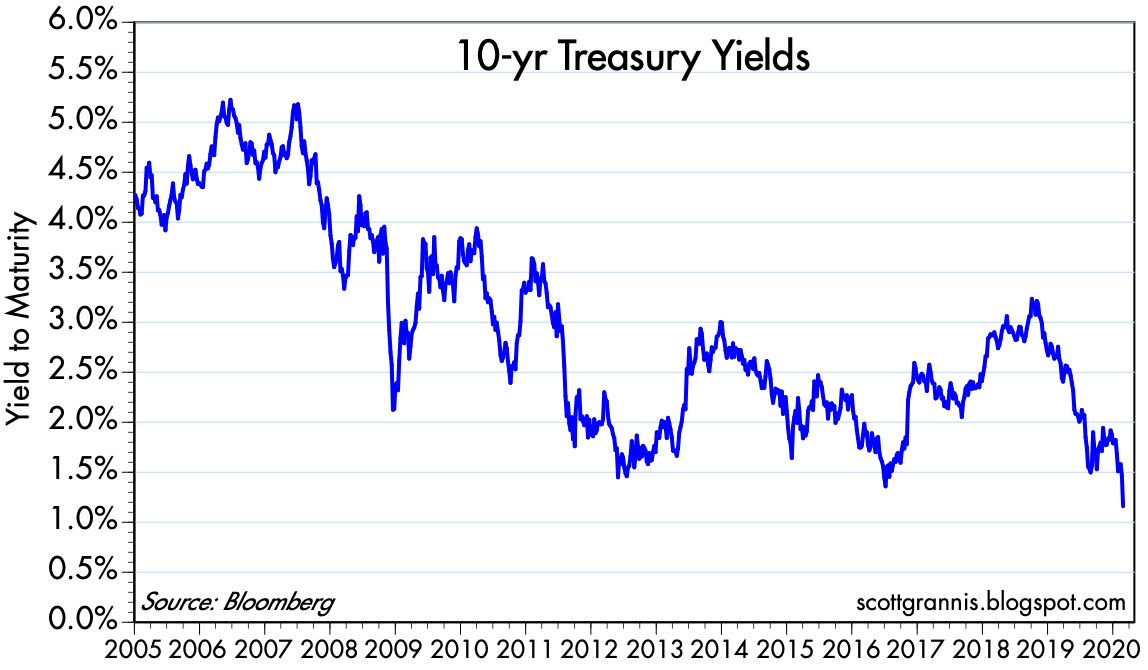
Chart #4 shows the history of 10-yr Treasury yields. Today they hit an all-time low of 1.3%. This is a big reason why the Vix/10-yr ratio is so high today.
Chart #5
Chart #5 zooms in on the data in Chart #4. Here it becomes clear that today's 10-yr yield marks the lowest closing yield in history. The previous record low was set in mid-2016, when markets were panicked over collapsing oil prices and the threatened breakup of the European Union (i.e., Brexit).
Chart #6
Chart #6 shows the history of the Vix index. Here we see that by this measure, today's level of "panic" is far below that of past panics. Markets today are pessimistic about economic growth, but markets are not expecting recession nor are participants willing to pay exorbitant prices to avoid downside risk.
Chart #7 shows Credit Default Swap spreads, which in turn are a highly liquid measure of the market's confidence in the outlook for corporate profits. Credit markets today are worried, yes, but hardly in a state of panic.
Chart #8
Chart #8 compares the inverse of the dollar's value against other major currencies to the inflation-adjusted price of gold. In general, the dollar's value tends to strengthen as gold prices weaken, and vice versa. But it's notable that in the past two years, just the opposite has been the case. Gold prices have surged and the dollar has strengthened. I take this to mean that the current rise in the price of gold is driven almost entirely be fear, and not at all by concerns that the Fed is making a policy mistake which will erode the dollar's intrinsic value. Gold is not rising because of inflation fears. Inflation expectations have been relatively steady at modest levels (1.5-2.0%).
Chart #9
Chart #9 compares the inverse of the dollar's value to an inflation-adjusted index of non-energy commodity prices. As with Chart #8, we see that a stronger dollar tends to correlate to weaker commodity prices and vice-versa. Commodity prices today are behaving much as we would expect, given the relative strength of the dollar. Gold is the one significant outlier in the commodity universe, which again suggests that it is being driven much more by fear and the desire for safety than by monetary fundmentals.
Chart #10
Chart #10 shows the level of 2-yr swap spreads in the US and the Eurozone. Both are trading well within "normal" ranges, which suggests that liquidity is abundant in the major markets that count the most. Monetary policy is not threatening, and systemic risks are low. This further suggests that the panic over Covid-19 is just that—the virus has yet to make a material impact on global financial and economic fundamentals.
In sum, while there are obvious signs of panic out there, we are not yet in the midst of a "run for the exits" panic. Things could get worse as the virus spreads, but the outlook could quickly change for the better if science finds a vaccine or a mitigating treatment.
What to do in the meantime is a tough call which depends on your tolerance for pain.
UPDATE as of market close Feb 25. The Vix/10-yr ratio has moved higher, and the equity sell-off has intensified. It's still a relatively modest sell-off however. The S&P 500 is only down a little more than 7.5% from its all-time high.
Chart #11
UPDATE: as of market close Feb 27. We are now entering true panic territory. The Vix/10-yr ratio, now at 31 (see Chart #12), is way above its last all-time high, which was 22.4 in late 2011, at the height of the Brexit/PIIGS default fears. As I mention above, the main reason for this very elevated level is the extremely depressed yield on 10-yr bonds, which today fell to a new all-time low of 1.26%. As Chart #13 shows, the Vix index is hardly in record territory. Nevertheless, it's fair to say that never before has the world been so pessimistic about growth and so desirous of safe assets (as witnessed by the 10-yr yield), but not yet in true panic mode (which would be reflected in a much higher Vix index). Things are ugly, but nobody is jumping out of windows yet. The problem is that we're dealing with an unknown variable (Covid-19) that could have a significantly negative impact on global GDP.
On the positive side, progress on a vaccine is underway. And should the virus fail to achieve pandemic status, the upside would likely be just as dramatic as the current sell-off.
Chart #12
Chart #13

UPDATE: As of Friday, Feb 28, 10:30am EST. The market is now in full panic mode, and things are getting very ugly. 10-yr Treasury yields are down to a new all-time low, 1.17%. The fear and panic that is surging around the world have the effect of greatly increasing what was already a strong demand for money and save assets. The entire Treasury curve is now inverted relative to the Fed's target (currently 1.75%), so the Fed will need to cut rates at least twice to offset the strong demand for money. Every day they don't makes things worse. And with the panic eroding confidence and weakening global economies, politics has now entered the fray, with the left accusing Trump of making things worse. Schumer on Tuesday
said "the administration’s handling of the virus has been marked by 'towering and dangerous incompetence.'" This arguably improves the chances that Sanders becomes our next president and unleashes a wave of growth-damaging tax hikes and government power grabs.
It's the stuff of nightmares, and the market reflects this. Consequently, the seeds for a recovery are being sown. All it takes to spark a rebound is news that suggests things are not as bad as everyone fears. As Chart #15 shows, the Vix "fear" index is now at levels that have been the high-water mark for previous panics, with the sole exception being the full-blown global financial panic of late 2008.
Chart #14
Chart #15
UPDATE: as of 1:45 EST. The panic is slowly receding.
Chart #16
I've shortened the time frame for Chart #16. Now it covers only three years. Last Friday (Chart #14) the Vix/10-yr ratio soared mid-day to over 40, then retreated. It's now down to 31.
Chart #17
Chart #17 shows the Vix index by itself. Each bar represents one month of data, with the low, high, and closing levels. Note how the current Vix reading, about 30, is far below last Friday's high of almost 50. That day may well mark the max height of the current wall of worry.


 Posts