This blog has discussed the importance of an inverted yield curve numerous times over the past decade. As I've noted, an inverted yield curve has preceded every recession in modern times, so it bears watching, but it's not the only thing to watch. The yield curve is inverted now, but there are other important indicators which at this time fail to confirm the yield curve signal. Market-based indicators suggest the economy and financial markets are still in reasonably healthy condition.
The most significant development is the extraordinarily low level of real and nominal interest rates in the US and in most major developed economies. I believe that very low interest rates are not necessarily a sign of an impending recession, but instead likely reflect widespread risk aversion among market participants. Moreover, widespread risk aversion lessens the chance of negative surprises.
Chart #1
As Chart #1 shows, yield curve inversions (when the red line becomes negative) have preceded every recession since the 1950s. But there is one other variable which has also preceded every recession, and that is a real Fed funds rate (blue line) that is high and rising (e.g., at least 3-4%). Currently, the real funds rate is barely positive, which means that monetary policy is far from being so tight as to strangle the economy or to starve the market of much-needed liquidity.
Only one of these two classic recession indicators is flashing red. That the other is not is due to the fact that monetary policy since 2009 has functioned in a very different way than it did prior to 2009. Prior to 2009 Fed tightening involved draining reserves (which at the time paid no interest) from the banking system, which in turn pushed up the Fed funds rate and made borrowing more expensive. It also restricted liquidity in the banking system, which often exacerbated problems stemming from rising real borrowing costs. Since late 2008, monetary policy tightening has only involved a decision by the Fed to increase the rate of interest it pays on bank reserves (something it never did before); meanwhile, bank reserves have remained abundant, and liquidity has generally remained plentiful.
Chart #2
As Chart #2 shows, the recent decline in real yields on 5-yr TIPS (from just over 1% prior to late 2018 to now zero) suggests that the market expects the economy to slow to a 2% pace going forward. As the chart further suggests, real yields on TIPS have a tendency to track the real growth trend of the economy. Today's low and negative real yields do not necessarily imply that the market is expecting a recession, more likely simply a slowdown in the pace of growth. And to date, that appears to be exactly what is happening, thanks in large part to the uncertainty and disruption caused by Trump's tariff war with China.
Chart #3

Chart #3 shows 2-yr swap spreads, which are not only excellent indicators of financial market liquidity conditions, but also excellent predictors of economic health. Swap spreads are very low these days, both in the US and in the Eurozone. This is a strong indication that liquidity remains plentiful—let's not forget the almost $1.5 trillion in excess bank reserves—and systemic risk remains low. All positive for future growth prospects.
Chart #4
Chart #4 shows that small business owners are quite optimistic about current and future business conditions. That's important, because they are the main engine of jobs growth. Optimism is up significantly since Trump's election, and Trump's efforts to slash regulatory and tax burdens get a good portion of the credit for this in my book.
Chart #5
Consumers in general are also quite confident these days, as Chart #5 shows. Trump's election helped spark a surge in consumer optimism. Healthy business and consumer optimism at the very least suggests the absence of any deterioration in the health of the economy.
Chart #6
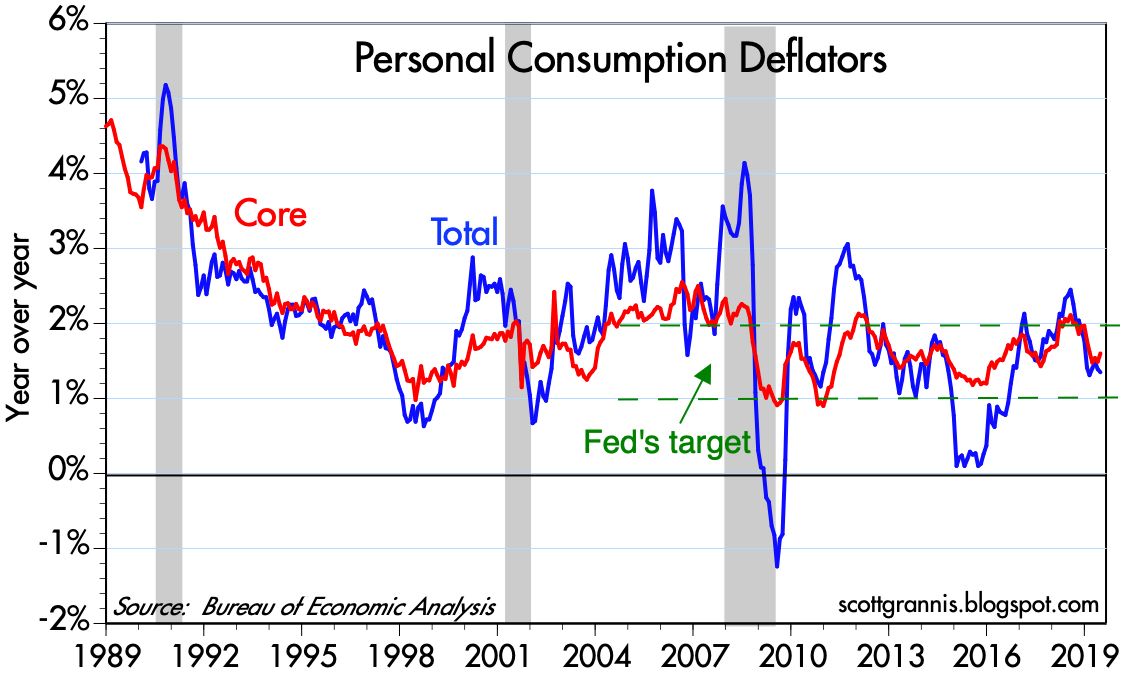
Chart #6 shows that rising inflation has typically preceded recessions. That makes perfect sense, since very tight monetary policy has been needed to bring inflation down, and as Chart #1 showed, tight monetary policy (marked by high real rates and an inverted curve) is the main reason recessions have occurred in the past. Today there is no problem at all with inflation, and thus no reason for the Fed to tighten. In fact, they are very likely to ease at the next FOMC meeting, if not before, as I
argued earlier this month.
Chart #7
As Chart #7 shows, recessions have typically been preceded by rising unemployment claims. Claims are a high frequency statistic that is released with a lag of only a week or so, so they are timely indicators of the health of the labor market. Currently, claims are very low and show no sign of rising. Businesses are therefore quite happy with the size of their workforce. If anything, the main problem facing most businesses these days is the difficulty of finding new hires.
Chart 8
As Chart #8 shows, deteriorating financial conditions also precede recessions. So far there has been no significant deterioration in Bloomberg's measure of financial conditions, which is quite comprehensive.
Chart #9
Chart #10
As Charts #9 and #10 show, rising corporate credit spreads also precede recessions. Today, however, they are quite low. This means that financial market participants have little or no reason to fear a significant deterioration of corporate profitability. In fact, today's low credit spreads are a good indicator that the outlook for corporate profits (and, by inference, the economy in general) is healthy.
Chart #11
As Chart #11 shows, fixed-rate mortgages are about as cheap as they have ever been. That's one reason the housing market continues to hold up well. Consumers are not being squeezed by high rates.
Chart #12
Chart #12 is one measure of the shape of the yield curve that is looking just fine. The very long end of the curve is mostly immune to Fed policy and Fed policy expectations, unlike the front end of the curve, which is where all the inversion is happening. The long end is nicely positively-sloped, which means that the market's long-term expectations for the economy and the outlook for inflation remain healthy.
Chart #13
Chart #13 (a new chart making its first appearance on this blog) shows the 3-mo. annualized rate of growth of demand and savings deposits at U.S. banks. I consider this to be a proxy for money demand, since the interest rate paid on these deposits is very low. People hold them mainly because they want to keep their money safe. What stands out is the recent and significant increase in the amount of money being stashed in these safe havens. Not surprisingly, this coincides with the recent bout of nerves triggered by Trump's trade war with China.
The big thing happening on the margin is a flight to quality/safety. (This shows up in the rising price of gold as well.) Strong money demand (and by inference strong risk aversion) is the driver behind the yield curve inversion, because the Fed has been slow to respond to an increased demand for money by reducing short-term interest rates.
Chart #14
10-yr Treasury yields have plunged this year, and are now closing in on all-time lows. But it's a phenomenon that is happening all over the developed world. As Chart #14 shows, yields in Germany and Japan are much lower than ours. Strong foreign demand for Treasuries could well be one of the main drivers of lower yields, since our yields are still much higher than anything you can find in major overseas markets. In short, there is a lot of risk aversion globally, and that is creating exceptionally strong demand for government bonds.
Chart #15
Chart #15 highlights the behavior of 10-yr real yields in the U.S. and Germany (and by inference the entire Eurozone). Eurozone real yields are now at record lows, and far below their U.S. counterparts.
Chart #16
As Chart #16 suggests, the huge difference between real yields here and in overseas markets is being arbitraged by market forces. The spread between US and German real yields has been narrowing sharply so far this year, at the same time as the dollar has been rising against the Euro, because money is leaving Europe in search of higher returns in the US.
Global risk aversion and a flight to safe havens is what's going on behind the scenes just about everywhere—not fears of recession. It shows up in very low and negative yields (because demand for sovereign bonds is extremely strong), and in rising gold prices.
Chart #17
As Chart #17 shows, equity valuations are not out of line with the level of real yields. Both tend to move together. High real yields typically accompany strong economic growth and strong corporate profit growth, which drives PE ratios up. The equity market itself is displaying signs of risk aversion, even as PE ratios are above average; small caps are underperforming large caps, and that happens when people see slowing economic growth.
Risk aversion appears to be significant, but it's not necessarily something to worry about. A risk averse market is less prone to disappointments, and more able to withstand adverse shocks.


 Posts