There's no shortage of bad news these days.
China is in the midst a serious slowdown after years of barn-burner growth, the yuan is falling, and authorities are trying to keep the stock market from melting down. Commodity markets have been brutalized, especially oil. High-yield corporate bonds have tumbled. The S&P 500 barely eked out a positive return last year, and is off to a weak start this year. The ISM manufacturing index in December fell to its lowest level in over six years. The Middle East is deteriorating by the hour. Rogue states are gaining nuclear weapons capabilities, while terrorists are sowing fear in Europe and the U.S.. The U.S. body politic seems more isolationist than ever. The U.S. economy remains mired in its weakest recovery ever. A lack of confidence and burdensome tax rates have left business investment stagnant for the past four years, despite record-setting profits. Regulatory burdens are punishingly high. Neither of the two leading candidates for the U.S. presidency understands how the economy works, and both are advocating policies that could make things worse. And to top it all off, the Fed is raising rates despite tepid growth, a litany of troubling developments and very low inflation.
It's enough to make one despair. But the news is not all bad, and there is reason to think the economy will survive these problems as it has others before (e.g, the PIIGS crisis).


Pessimists argue that the Fed's easy money policies have inflated the prices of risk assets, but it's hard to square that claim with the facts in the first chart above, which shows that many risk assets have attractive yields relative to cash—which is one way of saying their prices are depressed, not inflated. The market price of the average high-yield corporate bond has fallen 17% in the past seven months, thanks mainly to the 40% decline in the price of high-yield energy sector bonds (which represent only 10% of the HY sector) since the middle of 2014, when oil prices began to collapse. Those price declines have pushed up the yield on the average high-yield bond to almost 9%. That's 710 bps more than the yield on 5-yr Treasuries with similar duration risk. That means the market is paying you over 7% a year to accept the risk of high-yield bond defaults. High-yield energy bonds are now yielding a staggering 16%. Emerging market debt carries yields of 7% or so, and the earnings yield on the S&P 500 is over 5%. If you're unwilling to take on risk, you must surrender a significant amount of yield, which is another way of saying that the market has priced in a lot of bad news.

The chart above shows the difference between the earnings yield on stocks and the yield on risk-free 10-yr Treasury bonds. It's unusual for the equity risk premium to be as high as it is today. Investors would not remain indifferent to such high yields on equity securities vis a vis their risk-free counterparts unless they expected earnings to decline in the future. Bad news is priced in.


There are still lots of worries about debt (e.g., the federal government owes $13.6 trillion, an amount equivalent to almost 75% of GDP), but when was the last time you heard someone point out that U.S. households' finances are in great shape? As the first chart above shows, households' financial burdens (monthly payments as a percent of disposable income) haven't been as low as they are now for over three decades. The household sector has managed a significant deleveraging during the current business cycle expansion, even as the government has leveraged up. In addition to deleveraging over the past seven years, household net worth has risen by $28 trillion to a current $84 trillion—a record-high level in nominal, real, and per capita terms—thanks to rising home prices, savings, and investment gains.

As the chart above shows, the U.S. economy has been creating jobs at the rate of just over 200K per month for the past 5 years. (The December ADP report released today suggests the payroll number to be released Friday is likely to be at least 200K.) We could and should be doing even better than that, but it's nothing to sneer at. The underlying problem is
weak productivity growth, which has been averaging only 0.6% per year for the past 3 and 5 years, and is most likely the result of weak business investment. That pales in comparison to the 2-3% rates of productivity we saw in the mid-1980s and late 1990s. Still, even weak productivity coupled with 2% jobs growth gives you overall growth of 2.5% or so, and both these trends remain in place.
The PE ratio of the S&P 500 is just under 18 today, according to Bloomberg, and that is modestly above its 55-year average of 16.7. You might think that's a sign that the market is optimistic about the future, but it's not. As the first chart above shows, PE ratios tend to track the real yield on 5-yr TIPS, and—as the second chart suggests—that level of real yields is consistent with an expectation of real economic growth of only 1-2%.
In other words, the economy has been growing around 2–2.5% per year since the recovery started, but the market worries that future growth will be more like 1-2%.
Corporate profits have attained record-setting levels relative to GDP during the current expansion, and are currently far above historic norms. But the market worries that the economy will slow and profits will be mean-reverting and that, in turn, implies zero or negative growth for profits for years to come. Again, bad news is priced in.


The first chart above reveals a significant downward trend in the prices of 5-yr TIPS and gold that has persisted for the past three years. (I use the inverse of the real yield on TIPS as a proxy for their price.) Why would investors be paying less and less for these two assets, both of which offer protection from financial storms? (TIPS offer inflation protection, while gold is a classic safe-haven asset which promises protection from a variety of risks, both financial and geopolitical.) The answer, I believe, is that investors have been slowly recovering the confidence they lost in the 2008 financial crisis and the PIIGS crisis in late 2011. I note that the prices of both of these assets peaked around the time of the Eurozone PIIGS crisis. Since then, as the second chart shows, consumer confidence has increased significantly, although it is still below previous highs. Confidence has returned, but markets are still cautious. Bad news is priced in.
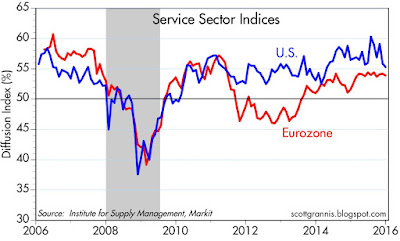
The manufacturing sector has suffered, as reflected in weak growth in industrial production (down 1% in the past year) and a weak ISM manufacturing index. But manufacturing accounts for only 10% of total private payrolls: a mere 12.3 million workers out of total private payrolls of almost 121 million. Moreover, manufacturing has been a shrinking part of the economy for a very long time. Example: after the end of WWII, manufacturing payrolls represented fully 35% of total private payrolls. So the health of the much larger service sector is the thing to watch. As the chart above shows, the service sector is in decent shape, both here and in the Eurozone.
In my
2016 forecast, I call for a continuation of modest growth that is disappointingly slow. The reason I'm optimistic is that I'm seeing continued modest growth and very little chance of recession at a time when the market worries that conditions will worsen.
I fully acknowledge all the bad news out there, but the bad news has been around for a while and most of it is priced in. The economy has been sluggish precisely
because of this bad news, which has sapped confidence and kept investment weak. If the news—and the policies—were to improve, we'd be seeing more confidence, more investment, and faster growth. If nothing improves, the economy is likely to continue plodding along at a 2–2.5% growth rate.


 Posts


