As I noted last week, the jump in claims was bogus, the result of flawed seasonal adjustment assumptions. This week claims fell by more than they rose last week, so claims are back on their declining trend.
At this rate, it won't be long before we see claims fall to 300K per week or a bit less, and that is about as good as it gets for the labor market. The most important thing that claims tell us is that there is no sign of any deterioration in the labor market, and therefore a recession or even a signficant slowdown in growth is very unlikely.
One of the most significant trends in today's labor market is the decline in the number of people receiving unemployment insurance. That is down by over 19% in the past year, or 1.24 million people. This is a powerful trend, since it creates incentives for large numbers of people to seek out and accept employment. Many have no doubt been discouraged in this effort, however, as witnessed by the very weak growth of the labor force—millions have simply "dropped out" and decided to stop looking for a job. But many of those are likely still on standby, ready to re-enter the labor force should job opportunities and other incentives to work improve.
Thursday, April 11, 2013
Wednesday, April 10, 2013
Come and get it
This isn't the first time I've called the low in mortgage rates, but it could be the last. The chart below shows the nationwide averages according to BanxQuote: currently 3.49% for conforming, and 3.68% for jumbo loans. Jumbo rates briefly dipped to as low as 3.55% last December. That could well prove to the be lowest level in my lifetime. All it takes for rates to move higher is continued economic growth, even if it's relatively sluggish. That would bring the Fed closer and closer to the end of its QE3 program, and the Fed is already hinting that they might well discontinue it before the end of this year, or as early as mid-year.
The Fed now owns about 11% of the nation's $9.5 trillion of home mortgages (data in the chart only goes up to the end of last year, but the Fed is still buying $40 billion of MBS per month). This is not likely to increase much before QE3 ends. I don't think that Fed purchases of MBS have resulted in any meaningful reduction in mortgage rates, but I could be wrong. In any event, the end of QE3 means that the Fed thinks the outlook for the economy is improving, and that should help dissuade the market from continuing to pile into and/or hold long-term, fixed-income securities that are trading very near all-time lows.
For investors it's a warning shot across the bow. For home buyers, it's "come and get it!"
And if I'm wrong and mortgage rates continue to decline, it's relatively easy and cheap to refinance.
UPDATE: I should add that with the deductibility of mortgage interest and inflation, a 30-yr fixed-rate mortgage is essentially free money. The CPI has averaged about 2.5% for the past 15 years, and most folks with a jumbo loan should be able to deduct about 35% of the interest. The after-tax interest cost would be about 2.5%, and subtracting inflation of 2.5% gives you zero.
There are of course downside risks. You would be exposed to a further decline in housing prices, another recession, and/or a bout of deflation. But if any or all of those happen, interest rates are likely to decline further, leaving open the possibility of refinancing.
Impressive progress in the federal budget
Thanks to a gridlocked Congress and a recovering economy, the federal budget has registered some impressive improvements in the past three years. Spending has not increased at all, while tax revenues have surged by over $550 billion, with the result that the burden of the federal budget deficit has dropped almost in half, from 10.5% of GDP to 5.75%. As the federal government absorbs less and less of the economy's output, this opens the door for a stronger private sector. This is a very encouraging development that is not widely appreciated or understood.
For the 12 months ended March, 2013, federal spending was $3.49 trillion. As the chart above shows, spending has not increased at all since the end of the 2008-09 recession. Revenues, in contrast, have risen from a post-recession low of $2.02 trillion to $2.58 trillion in 12 months ended March, 2013. The federal budget deficit has fallen from a high of $1.47 trillion in late 2009 to $910 billion in March of this year. Revenues are now only about $20 billion shy of an all-time high. This is real progress: the best way to grow revenues is to grow the economy without raising tax rates, and the easiest way to "cut" spending is to just not let it grow.
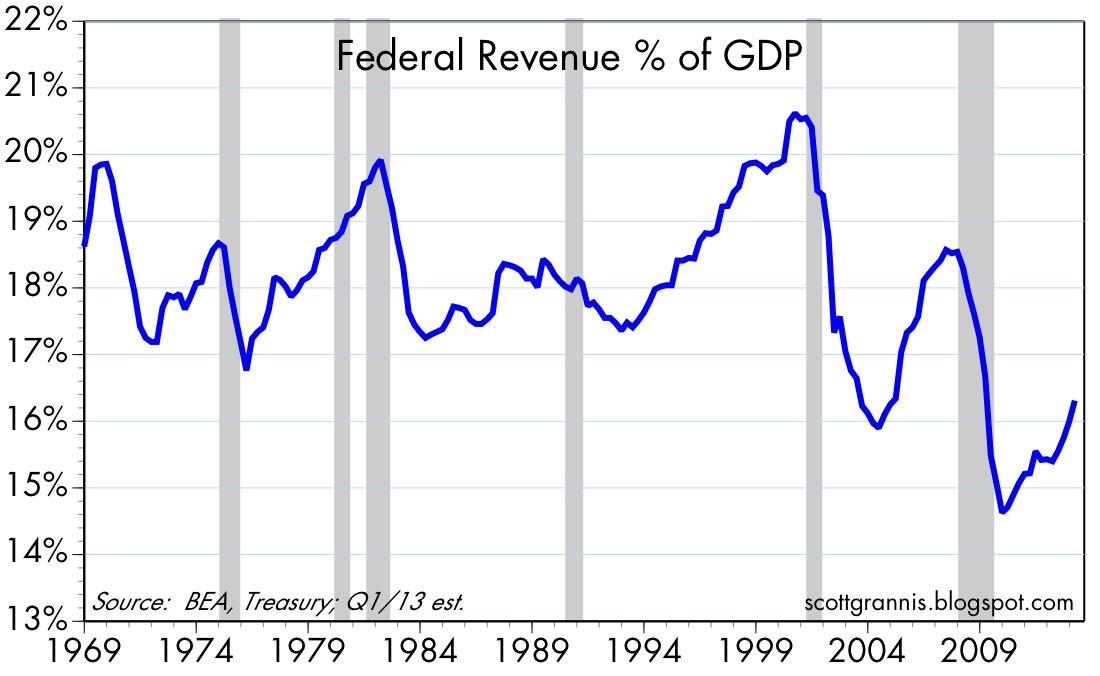
Despite no effective increase in tax rates in recent years (and in fact a 2-yr reduction in payroll taxes), revenues have grown much faster than GDP—as is typical during a recovery.
With spending flat but nominal GDP now up over 15% since the recovery started, federal spending as a percent of GDP has fallen from a high of 25.2% to about 22%. It is now within the post-war historical range.
The chart above combines the previous two charts for a better historical picture of what's happening. Both revenues and spending are slowly but surely coming back into line with their historical averages.
The reduction in the burden of the federal deficit has been impressive, although it is still a bit larger than it was at its Reagan-era peak.
One important source of the reduction in spending has been automatic stabilizers like unemployment insurance. As the economy has grown, the number of people receiving unemployment insurance has declined by 3.3 million from its peak in mid-2010.
Unfortunately, the impressive progress to date in the budget is threatened by the looming onset of Obamacare, which will almost certainly increase government spending significantly as it also raises healthcare costs. Moreover, the financial health of social security worsens with each passing year, due to the very low level of labor force participation and increasing life expectancies. But at least for now we are making excellent progress.
Note: in calculating revenues, spending, and the deficit as a % of GDP, I have assumed that nominal GDP grew at a 4.4% annual rate in the first quarter.
For the 12 months ended March, 2013, federal spending was $3.49 trillion. As the chart above shows, spending has not increased at all since the end of the 2008-09 recession. Revenues, in contrast, have risen from a post-recession low of $2.02 trillion to $2.58 trillion in 12 months ended March, 2013. The federal budget deficit has fallen from a high of $1.47 trillion in late 2009 to $910 billion in March of this year. Revenues are now only about $20 billion shy of an all-time high. This is real progress: the best way to grow revenues is to grow the economy without raising tax rates, and the easiest way to "cut" spending is to just not let it grow.
Despite no effective increase in tax rates in recent years (and in fact a 2-yr reduction in payroll taxes), revenues have grown much faster than GDP—as is typical during a recovery.
With spending flat but nominal GDP now up over 15% since the recovery started, federal spending as a percent of GDP has fallen from a high of 25.2% to about 22%. It is now within the post-war historical range.
The chart above combines the previous two charts for a better historical picture of what's happening. Both revenues and spending are slowly but surely coming back into line with their historical averages.
The reduction in the burden of the federal deficit has been impressive, although it is still a bit larger than it was at its Reagan-era peak.
One important source of the reduction in spending has been automatic stabilizers like unemployment insurance. As the economy has grown, the number of people receiving unemployment insurance has declined by 3.3 million from its peak in mid-2010.
Unfortunately, the impressive progress to date in the budget is threatened by the looming onset of Obamacare, which will almost certainly increase government spending significantly as it also raises healthcare costs. Moreover, the financial health of social security worsens with each passing year, due to the very low level of labor force participation and increasing life expectancies. But at least for now we are making excellent progress.
Note: in calculating revenues, spending, and the deficit as a % of GDP, I have assumed that nominal GDP grew at a 4.4% annual rate in the first quarter.
Subscribe to:
Posts (Atom)