Thursday, November 30, 2023

A reassuring outlook


This is a short post to update M2, GDP, and inflation statistics. All are consistent with the view that the economy is growing at a moderate pace and inflation is fast approaching the Fed's target (indeed, by some measures it is already below target).

M2, the most important monetary variable that the world (and the Fed) seem resolutely to ignore, continues to decline. It ballooned in 2020 and 2021 as $6 trillion in deficit-financed COVID "stimulus" spending was mysteriously monetized. Since then, excess M2 has dropped by more than half, and the remainder has been effectively neutralized by Fed interest rate hikes.

In apparent defiance of multiple forecasts that Fed tightening would surely result in a 2023 dominated by recession, GDP grew at a recently-revised and robust 5.2% annualized rate in the third quarter. Once again, market wisdom (e.g., the economy has the unique ability to confound the majority of forecasts) has proven correct. Those who still adhere to Phillips Curve thinking are still scratching their heads: how is it that the economy can strengthen even as the Fed tightens and inflation falls?

It is now abundantly clear that the Fed has no reason to tighten monetary conditions any further. Inflation is within spitting distance of its target. Indeed, the only question at this point is When will they begin to ease? The market is now quite sure that the first easing will come at the May '24 FOMC meeting, but there is no reason they can't ease well before then. Thus, there is reason to remain optimistic about the outlook for the economy and the financial markets.

Chart #1

Chart #1 shows the level of the M2 measure of the money supply, arguably the best measure of money that is easily spendable. Since 1995, M2 grew by about 6% per year, all the while inflation remained relatively low and stable. The "bulge" in M2 has now shrunk by more than half, thanks to negative M2 growth and ongoing growth in prices and the size of the economy. 

Chart #2

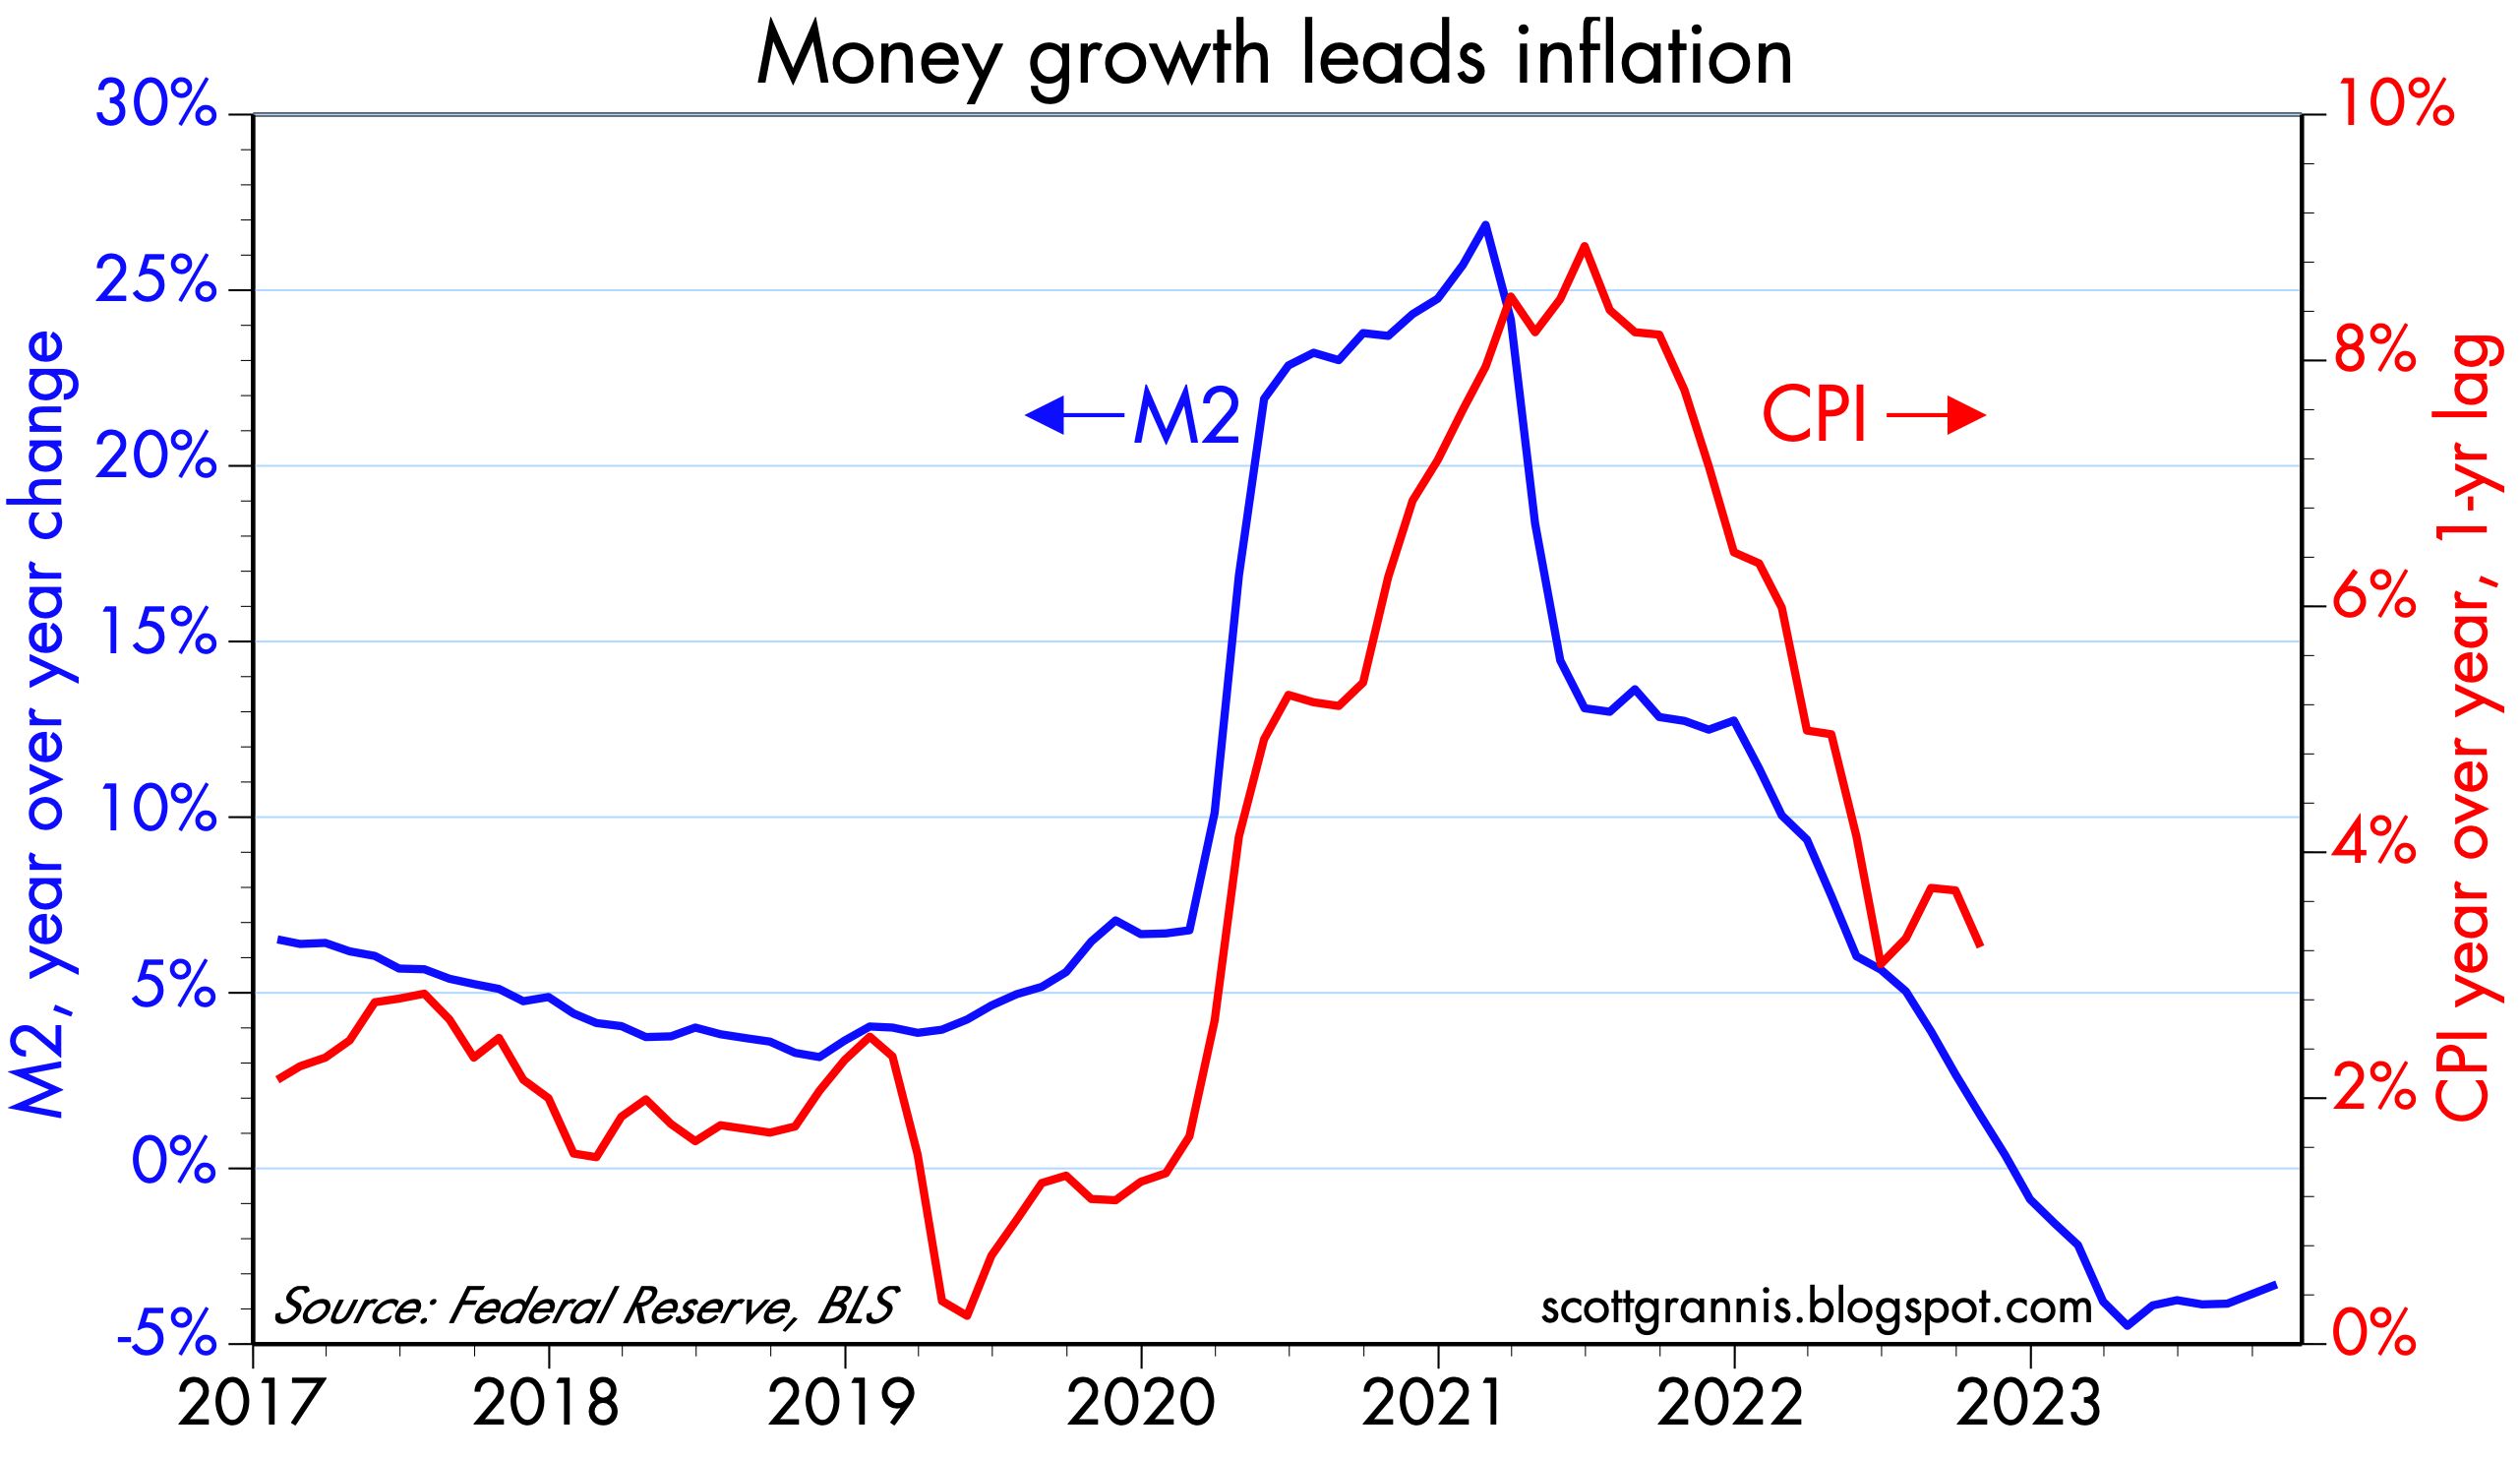
Chart #2 is designed to show how growth in M2 predicts inflation by about one year. Negative M2 growth since late 2022 strongly suggests that measured inflation will be declining for the next year.

Chart #3

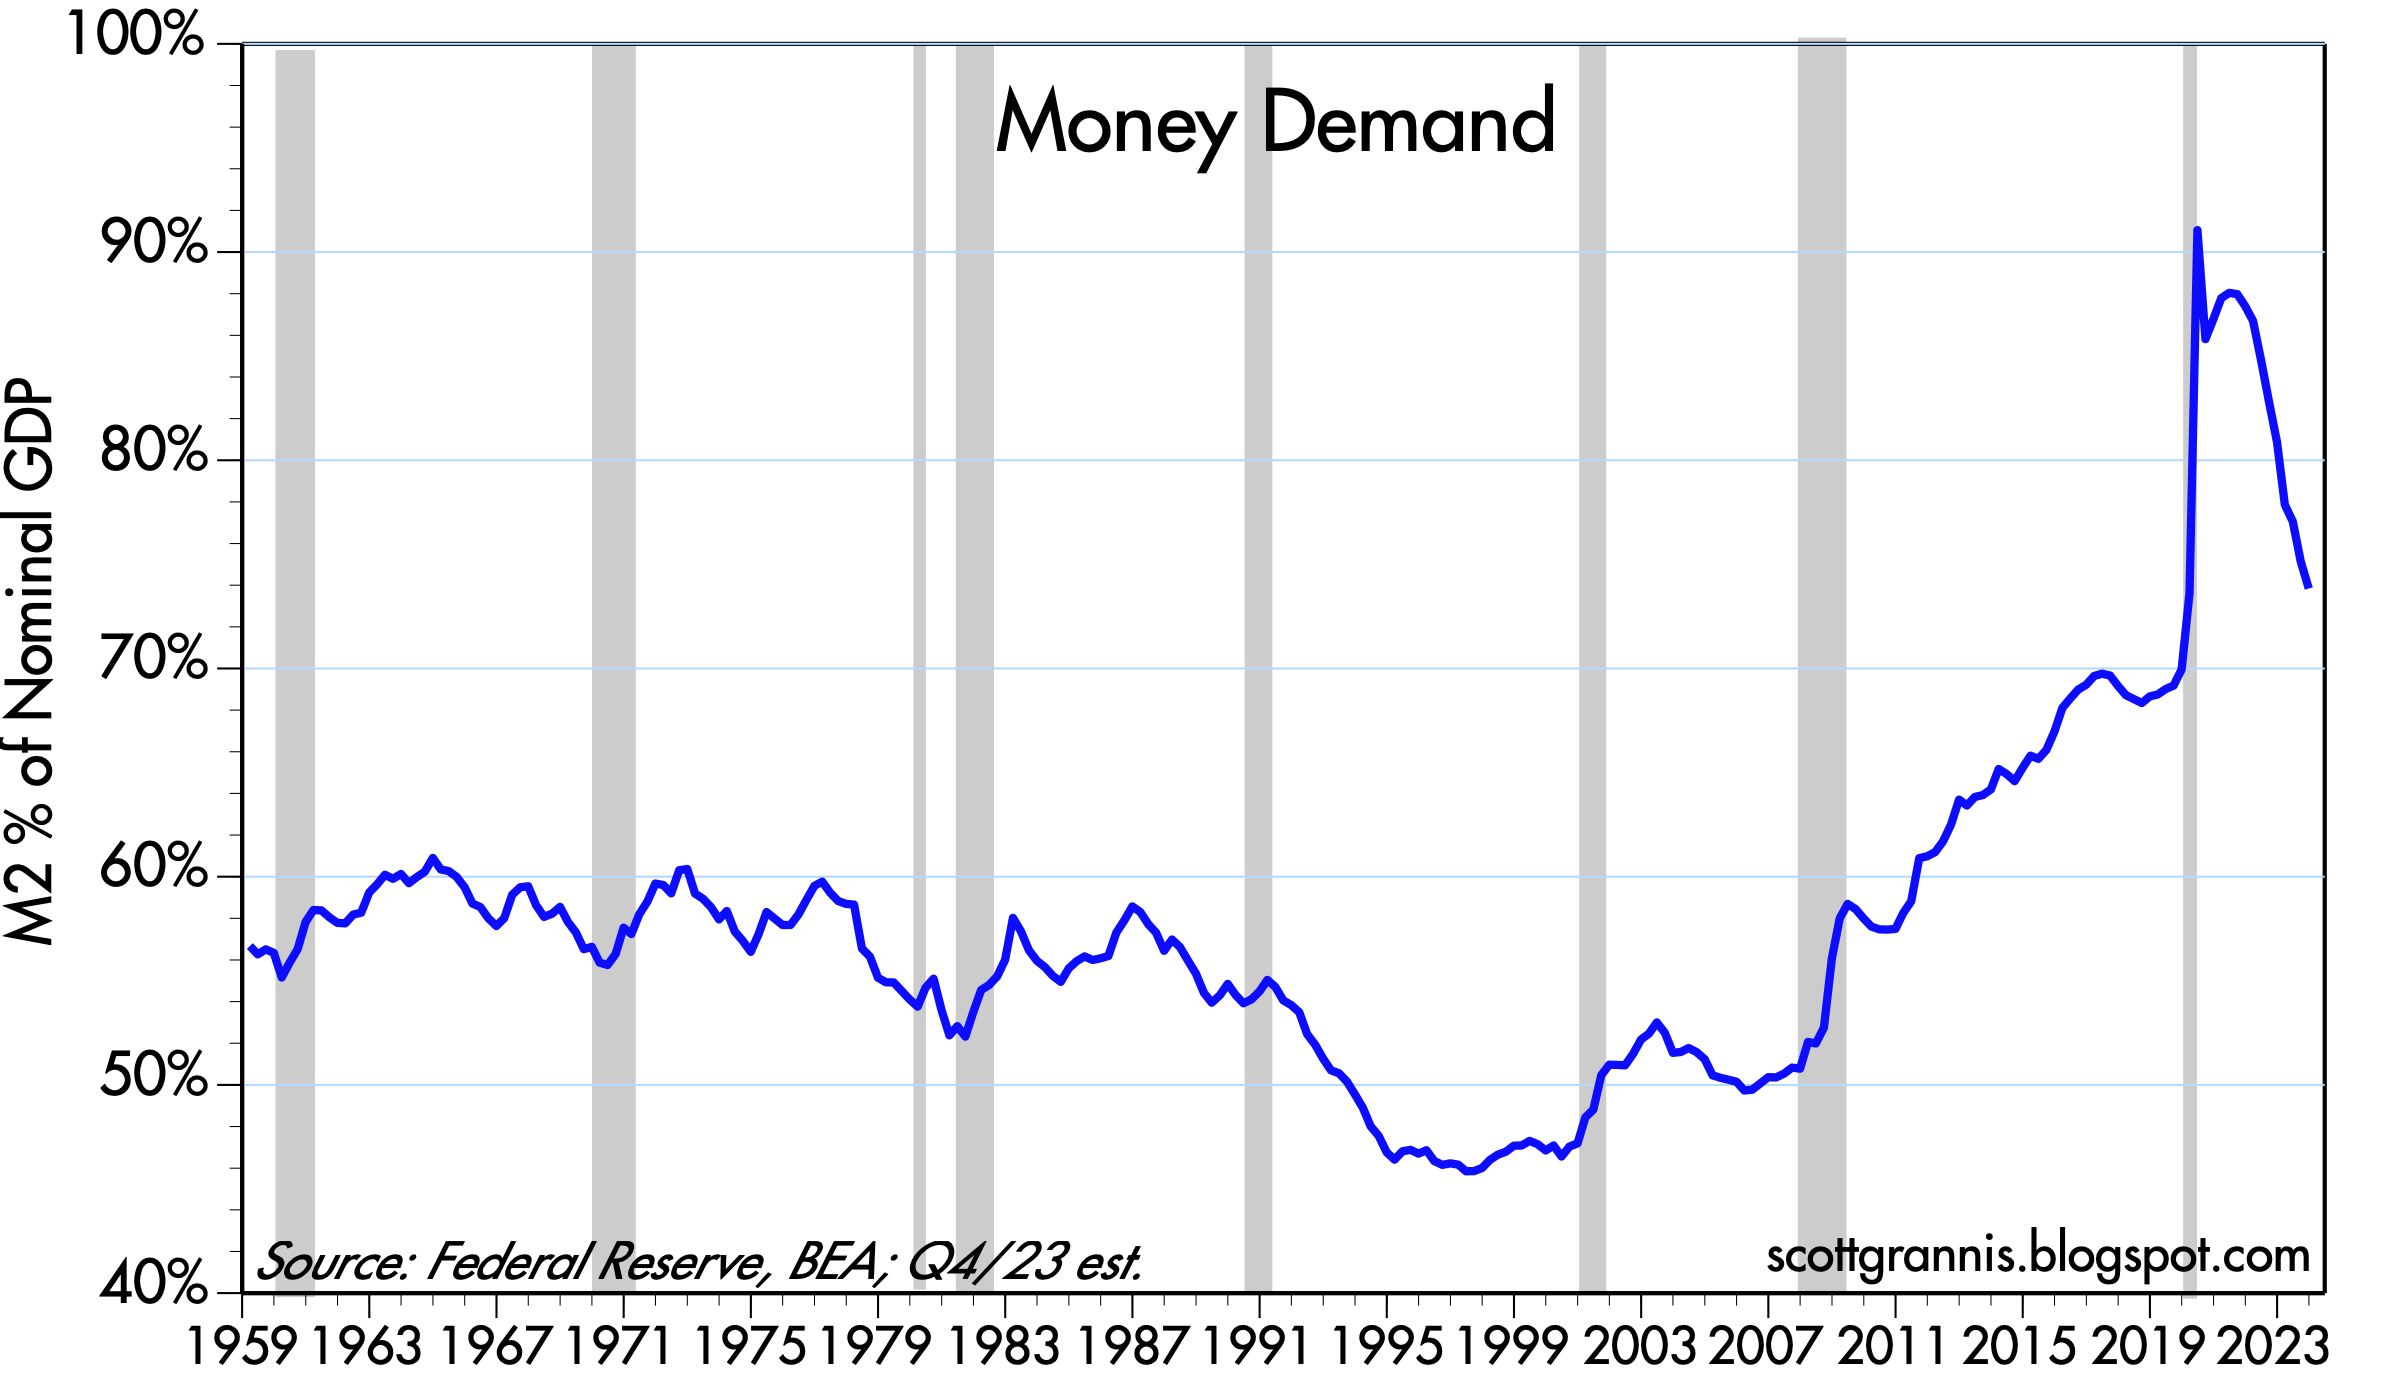
Chart #3 looks at what I call "Money Demand." It's the ratio of M2 to nominal GDP, and it is best described as the amount of readily-spendable cash money that households are willing to hold expressed as a percentage of their annual income. Money demand surged during the onset of the Covid crisis, only to then collapse as the world slowly returned to normal. In times of crisis it is natural for folks to want to hold bigger money balances, and to subsequently spend down those balances as the crisis passes. Money demand today is almost back to where it was pre-Covid by this measure. Today, folks are still willing to hold some extra cash thanks to the fact that interest rates on cash have soared. Short-term interest rates of 5% or so actually more than make up for current inflation rates of 3% or so. So there's an incentive to hold on to cash rather than spend it. For most of the past 3-4 years or so, those incentives were reversed: interest rates were lower than inflation, so the smart thing to do was to "borrow and buy." Today the monetary incentives are tilted to "save and invest."

Chart #4

Chart #4 looks at the 6-mo. annualized rate of inflation according to the total and core versions of the personal consumption deflator. Both have now fallen to 2.5%, which is only marginally above the Fed's target of 2%. 

The inflation drama is over. 

Sunday, November 19, 2023

Congratulations, Javier Milei!


Javier Milei first appeared on my radar screen 3-4 years ago. At the time I thought he would be the perfect person to rescue Argentina from economic oblivion, because he sees things the same way I do. But then I realized that was almost impossible. How could he, a virtual unknown, ever overcome generations of Peronist rule and endemic corruption? Well, he did, and now he has a shot at pulling off one of the world's greatest turnarounds. Milei has beaten long odds to become Argentina's next president starting December 10.

For a person like me (libertarian, classic liberal, conservative, free marketer, monetarist), Milei is just about ideal. He knows exactly what ails Argentina and what is needed to turn things around. But it won't be easy, since Argentina's Deep State (much more entrenched and corrupt than our own Deep State) won't surrender without a fight. So of course the world's capital markets will be slow to revise upwards their projections for the Argentine economy.

But here's the thing: Argentina has fallen about as far and as fast as any country in history. It's a total mess. Raging inflation, a collapsing currency, rampant poverty, endemic and generational corruption—it couldn't be much worse. So much bad news has trashed Argentina's currency (see this post). As a result, the country can be bought for fire sale prices.

Investors will justifiably worry about the odds against Milei's success. So many things can go wrong. So many hurdles to clear. Where will he get all the dollars needed to dollarize the economy? How can he slash government spending and subsidy payments without sending millions to the poorhouse? How can he possibly dislodge legions of Peronist bureaucrats who don't even bother to show up for work until it is time to collect their monthly check?

Nevertheless, if Milei manages to get some traction with the monumental changes he is proposing, the upside potential for the Argentine economy is very difficult to overestimate. In my fantasies, I see Argentina inundated by a tsunami of foreign capital in the years to come. When the cheapest economy in the world suddenly becomes the one with the most upside potential .... Well, you fill in the blanks. It could be exciting, to say the least.


Wednesday, November 15, 2023

Inflation RIP


I've been predicting the demise of inflation for at least a year now, and today's CPI report makes it official—there's no denying that inflation has fallen to within spitting distance of the Fed's target. Not coincidentally, the market has finally acknowledged what I've been expecting for many months: the chances of another Fed tightening at this point are zero. The only issue now is when the Fed starts to cut rates; the market thinks the first cut comes at the May 1st FOMC meeting, while I think it happens much earlier.

Chart #1

Chart #1 compares the year over year change in the CPI to the CPI minus its shelter component (which comprises about one-third of the CPI index). Absent shelter costs, which we know have been artificially inflated due to the BLS's flawed methodology (see Charts #2 and #3), the CPI is up only 1.5% in the year ending October '23. In fact, by this measure, inflation has been at or under the Fed's target for the past six months.

Chart #2

Chart #2 shows the 1- and 3-mo. annualized rate of change in Owner's Equivalent Rent (the major component of shelter costs). Here we see that shelter costs have been rising at a 5-6% annualized rate for the past several months. Contrast this to the fact that nationwide housing prices, according to the Case-Shiller index, have only increased 1.4% since mid-2022. Bottom line, the OER is substantially overstating inflation.

Chart #3

Chart #3 is designed to show that the BLS methodology effectively uses changes in housing prices from 18 months prior to drive changes in Owner's Equivalent Rent. Big changes in housing prices thus feed into the CPI calculation with a lag of as much as 18 months! This chart also strongly suggests that the big deceleration in housing prices that began a year ago last summer will cause the change in OER to fall to close to zero over the next 9-10 months. That in turn strongly implies that the contribution to inflation that comes from shelter costs will be declining for many months to come. It wouldn't be surprising, therefore, to see overall CPI inflation fall into negative territory in the next 3-6 months.

Chart #4

Chart #4 shows that changes in the growth rate of the M2 money supply tend to show up in similar changes in the rate of inflation with about a 1-year lag. This is strong evidence that the recent bout of inflation we have endured had a monetary origin. As I've explained numerous times in the past year or two, the source of our inflation surge can be traced to the monetization of some $6 trillion in federal deficit spending in 2020-2021. Happily, there has been no further debt monetization since 2021.

Chart #5

Chart #5 shows the 6-mo. annualized rate of change of overall and core producer prices (producer prices tend to be upstream of consumer prices, so this is like seeing a preview of the trend of the CPI in the months to come). By this measure, inflation is running at a 0-2% rate. Moreover, the producer price index has not changed at all since June '22

Inflation is dead, may it Rest In Peace.

Is there any reason at all for the Fed to hold off on lowering rates until May? Not that I can see.

Monetary policy is manifestly tight, as reflected in a variety of indicators: 1) a significant deceleration in the rate of nearly all price increases, 2) a 57% plunge in new mortgage originations since early 2022 (i.e., high interest rates have severely impacted the housing market), 3) a 20% decline in non-energy commodity prices since early 2022, 4) at 2.3%, real yields on 5-yr TIPS (an excellent barometer of how tight monetary policy is) are substantially higher than their 28-yr average (1%), and 5) the yield curve is still inverted.

If the Fed remains true to form, they will wait too long to lower rates, just as they waited too long to raise rates two years ago. And that, in turn, means that when they eventually do lower rates, they will have to lower them faster and by more than if they were to start now.

The good news is that there is still little or no reason to think that the economy is at risk. Swap and credit spreads are low, implied volatility is low, initial jobless claims are low, and liquidity is abundant. 

UPDATE (11/16/23): Here is an updated bonus chart showing how the federal deficit was monetized in 2020 and 2021, and how that link was severed about a year ago. Today we have big and ongoing deficits measured in trillions of dollars, but they are no longer translating into big increases in the money supply. This is how it should be. Deficits should never be monetized, and as such they needn't be inflationary. But since today's deficits are the by-product of excessive spending, they represent a drag on growth. The government is borrowing money and spending it wastefully. That squanders scarce resources and depresses the economy's long-term growth potential. Our children and grandchildren will pay the price in the form of living standards that could have been higher. 

Chart #6