Long-time readers of this blog know that I have been one of only a handful of observers who have linked excessive M2 growth (i.e., money printing) to the big inflation problem that hit the US economy beginning in the first part of 2021. (
Here is one of my first posts on the subject in Feb. '21.) I continue to believe that excessive M2 growth was the biggest story that virtually no one—especially the Fed—paid any attention to, until it was too late. Fortunately, this problem began fading away two years ago, and it continues to do so.
It took the Fed a full year before they began to tighten policy, and as I see it, they could have begun to ease at least a year ago, but we now know they won't begin to cut rates until the mid-September FOMC meeting. Better late than never, I suppose, but their tardiness risks destabilizing the interest-sensitive sectors of the economy, particularly housing. In the meantime, the monetary fundamentals support the outlook for continued low inflation.
Chart #1
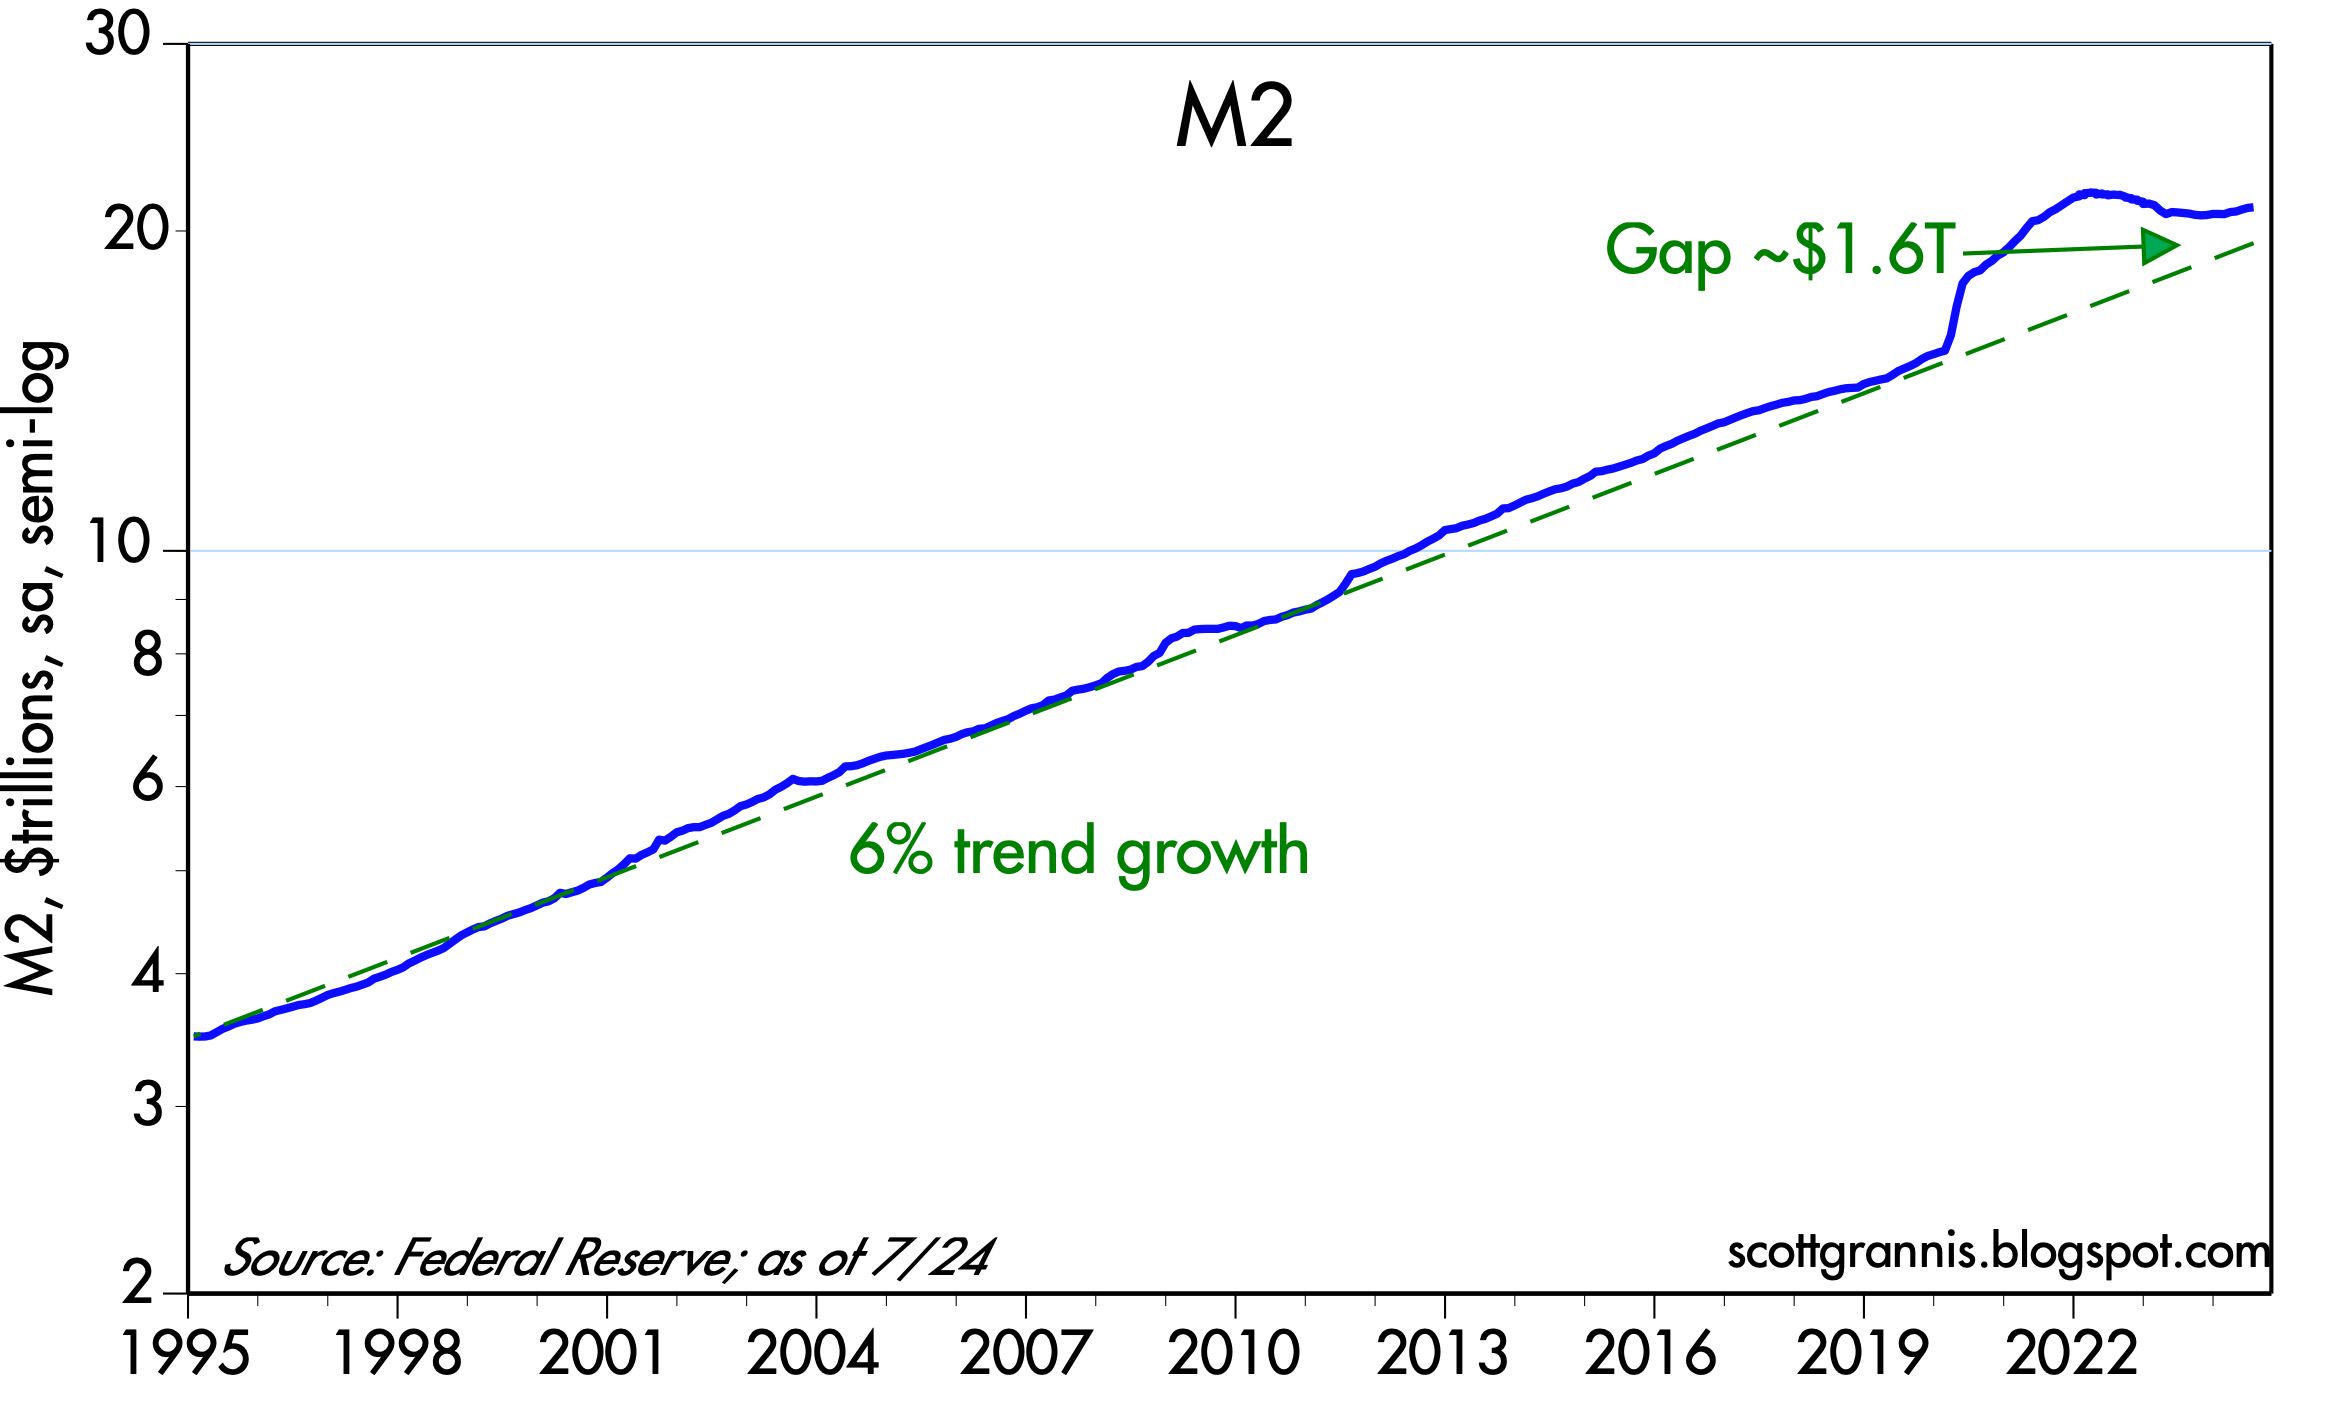
The M2 measure of the money supply grew at a fairly constant rate of 6% per year from 1995 through 2019. Then it exploded higher beginning in April 2020 as $6 trillion of Covid "stimulus" checks flooded the economy. Once the dust had cleared by late 2021, an extra $6 trillion of deficit spending had been monetized and was sitting in the form of readily spendable currency, bank deposits, and checking accounts (all components of the M2 money supply). This was the fuel for rising prices in 2022.
As Chart #1 shows, M2 has been flat to down since late 2021. It rose a mere 1.3% in the 12 months ending July '24 (according to the latest figures from the Fed, released earlier today). The monetary situation is almost back to normal, as M2 today sits only $1.6 trillion above its long-term trend growth.
Chart #2
Chart #2 compares the growth in M2 with the level of the federal budget deficit. This chart is the smoking gun which proves that the source of our great inflation episode was deficit-fueled spending. Fortunately, deficit spending is no longer being monetized; unfortunately, we still have a monstrous deficit spending problem. Deficits are primarily the result of excessive government spending, and that weakens the economy because it wastes scarce resources.
Chart #3
Chart #3 compares the growth of M2 to CPI inflation with a one-year lag. Roughly speaking, increases in M2 growth are followed by increases in inflation one year later. This chart suggests that we have another year or so of low and falling inflation "baked in the cake," thanks to very low money growth in the past year.
Chart #4
Chart #4 shows the ratio of M2 to nominal GDP. I think this is the best way to measure money demand. Think of it as a proxy for the amount of spendable money (cash, checking accounts, bank savings accounts, CDs, and retail money market funds) that people want to hold as a percent of their annual income. (Nominal GDP is an excellent proxy for national income.) Money demand soared in 2020, and that kept trillions of dollars of newly-minted M2 from creating inflation. It then collapsed, and that caused people to spend the money they had previously stockpiled. Extra demand fueled by unwanted money collided with supply-chain shortages to produce sharply higher prices.
I suspect that money demand is approaching sustainable levels, just as excess money supply (M2) is shrinking. That is a prescription for low and stable inflation.


 Posts
Posts