Thursday, March 30, 2017

Corporate profits and equity valuation

Today's revision to Q4/16 GDP statistics brought with it our first look at corporate profits for the quarter. My preferred measure (HT: Art Laffer) is after-tax profits adjusted for capital consumption allowances and inventory valuation, and it notched an impressive $1.61 trillion annual rate for the quarter. This measure has been consistently calculated ever since 1947, and as such it represents the most consistent and contemporary measure of the true economic profits of corporate America. Profits by this measure rose by an impressive 15.7% last year, but most of that rebound was due to the waning effects of the severe drop in oil prices which began in mid-2014. Now that the crisis in the oil patch has passed and oil prices are stabilizing, corporate profits are regaining their prior levels, which from an historical perspective are unusually high relative to GDP. Given that profits are historically quite strong, it is worth noting that equity valuations are only modestly above average.


Q4/16 GDP was revised slightly upwards to an annualized rate of 2.1%, which happens to be exactly the same as the annualized rate of growth of the economy since the current recovery began in mid-2009. It's been the slowest recovery on record. As the chart above shows, if the economy had instead regained its long-term average growth rate of 3.1% per year, the economy today would be roughly $3 trillion dollars bigger. I've called that the Obama Gap.

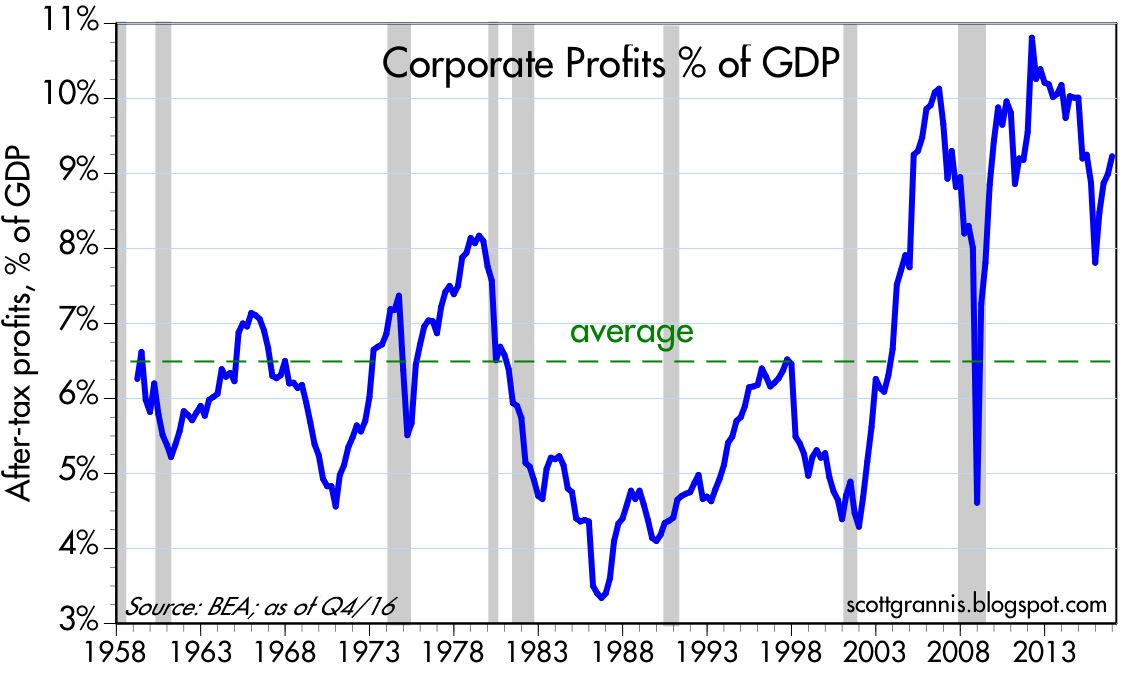

The charts above compare after-tax corporate profits to nominal GDP. It should be clear that despite this being a very weak recovery, corporate profits have been unusually strong. For years I've explained the shortfall in growth as being the result of very weak investment on the part of corporations; without investment their can be no productivity gains, and without productivity there can be no improvement in living standards. Both corporations and consumers have been generally risk-averse for the past 8 years, due to increased regulatory and tax burdens, and a general, anti-business sentiment emanating from Washington. Consumers have deleveraged significantly, while the government has borrowed heavily, absorbing ever penny of the profits generated by corporations since the recovery began. Corporations might have invested that money more efficiently, but instead the government spent most of it on transfer payments.


As the chart above shows, the increase in corporate profits over time has corresponded rather closely to the increase in equity prices. As I argued a few weeks ago, the stock market is not rising simply because of a "Trump bump," it is rising because global economic fundamentals are and have been improving, as is the outlook for corporate profits.


The chart above compares NIPA profits with reported profits (using Bloomberg's calculation of profits from continuing operations). Note that the two measures tend to track each other over time, with the NIPA measure leading the reported profits measure (because it is based on quarterly annualized profits, whereas the reported profits measure uses a 12-mo. trailing average). The rebound in NIPA profits last year is almost certain to show up in rising EPS in the months to come, and the stock market is priced accordingly. Ed Yardeni expands on this subject in a recent post here. For those interested in why the NIPA measure of profits has been consistently higher than the reported measure since the 1990s, see my post of a few years ago on this subject here.


The standard method of calculating equity multiples (PE ratios), is to divide current prices by a trailing 12-mo. average of earnings per share (see the second chart above). I've refined this a bit by using Bloomberg's calculations of PE ratios, which use only profits from continuing operations. A better way, I would argue (as Art Laffer convinced me many many years ago), is to divide current prices by the most recent quarterly annualized rate of profits as calculated in the National Income and Products Accounts (NIPA).  This compares current prices to the most recent measure of true economic profits. I've taken this analysis a step further (see first chart above), and calculated PE ratios for the S&P 500 using the NIPA measure of profits instead of reported corporate earnings (I then normalized the results so that the long-term average PE ratio using NIPA profits would be similar to the average PE ratio using reported profits). By either measure, PE ratios today are modestly or moderately above average, whereas corporate profits using the NIPA calculation are significantly above average. If I had to choose one, I would go with the NIPA version of PE ratios, which shows the equity valuations today are only modestly above average.


The chart above shows the equity risk premium, which I define as the difference between the earnings yield on stocks (i.e., the inverse of the PE ratio) and the yield on 10-yr Treasuries. This is the extra yield that the market demands in order to feel comfortable accepting the added risk of equities vs. risk-free Treasuries. In the boom times of the 1980s and 1990s this risk premium was consistently negative, a sign that the market was quite confident that equities were attractive. But for the duration of the current business cycle expansion, the premium has been consistently positive, a sign that the market has been quite reluctant to take on the added risk of equities. Risk aversion, as I've argued for years, has been one of the hallmarks of this recovery. It's been declining of late as confidence slowly rebuilds, but it would be difficult to argue from this chart that the equity market is priced to optimistic assumptions. I would further note that current risk premiums are about the same as the were in the late 1970s, during the infamous "Carter malaise."

Finally, I would note that these measures of equity valuation have nothing to do with surveys of investor and/or consumer sentiment. They rely solely on market-based measures, and as such, I think they are more reliable and informative.

Monday, March 27, 2017

Household finances are on solid ground

U.S. households' financial burdens (payments for mortgage and consumer debt, auto leases, rents, homeowner's insurance, and property tax, all as a percent of disposable income, are at historically low levels and have not budged for over five years. Moreover, the overall leverage (total liabilities as a percent of total assets) of the household sector is at 30-year lows. Coupled with the fact that weekly claims for unemployment are at historically low levels, this paints a picture of a household sector that is on financially solid ground, more so than at any time in decades.


Today the Fed released data for the fourth quarter of 2016 covering various measures of household's financial burdens. As the chart above shows, financial burdens have been historically low for over 5 years, and are substantially less now than they were prior to the past 3 recessions. I note that consumer debt includes student loans, which now total over $1 trillion and which continue to grow at a significant pace—the only area of consumer finance that is deteriorating, thanks to our beneficent government which is willing to grant student loans with little or no regard for a student's ability to pay.


Households' leverage has plunged by about one-third since the 2008 recession, as the chart above shows, and leverage is now back to levels last seen some three decades ago.


Initial claims for unemployment, shown in the chart above, haven't been so low for a very long time. Workers at social security offices around the country must have a lot of time on their hands these days!


The chart above compares unemployment claims to total payrolls. Here we see that the chances of a worker getting laid off are as low as they have ever been, and by a substantial margin. In recent weeks, only about 0.15% of the U.S. workforce has been handed a pink slip.

Household finances appear to be about as solid as they have ever been, and job security is also about as good as it has ever been. This is not to say we don't have problems, but these statistics are reassuring nonetheless, and not widely recognized.

Friday, March 24, 2017

Thoughts on the failure of Obamacare reform

I don't buy the conventional wisdom that says that this is a failure of leadership. Leadership alone cannot fix Obamacare. A solution to the problem of Obamacare is going to be extremely difficult, and it can't and shouldn't be done overnight. Obamacare was doomed to fail, as I pointed out many times over the years, because it attempted to rejigger a huge fraction of the U.S. economy, and that is something that is virtually impossible to accomplish in a successful fashion by government diktat. Only a freely functioning market economy can make something so huge and so complex work in an efficient manner. (Friedric Hayek, who died 25 years ago, explained why in this post from Mark Perry)

Thank goodness the Republicans didn't end up succumbing to the hubris that energized the Democrats under Nancy Pelosi's leadership, when they passed a bill so huge and so complex that she was forced to exhort its passage in order that they could find out what was in it. Thank goodness the Republicans didn't ram through a bill that had zero support from the opposition party (as Pelosi did), let alone strong support from their own party; that is not the way to accomplish major legislation.

Obamacare is imploding because it attempted to substitute government decree for market forces. So a fix to Obamacare is only going to work if it unburdens the healthcare market from government  influence. Ryan's proposed solution went a long way towards doing that, but it still relied on too much government interference in the healthcare market. Here's my recommendation: Let's put this intractable problem on the back burner; let's let Obamacare continue to fester; and let's wait until the Democrats beg for a solution and join in supporting new and better legislation.

Meanwhile, let's hope the Republicans can regroup and move on to tackle a big problem that should be a lot easier to solve, and which could end up delivering positive results for everyone in relatively short order: tax reform.

Successful tax reform should involve a few simple ingredients: tax rates should be lower and flatter than they are now, and deductions and subsidies should be far fewer. (Please, Republicans, please don't attempt to impose a Border Tax system on the U.S. economy, since that is very complex and it will have many unforeseen consequences, some good and some very bad. Please don't listen to Trump and his economically illiterate trade advisor Peter Navarro.) Lower and flatter tax rates coupled with fewer subsidies and deductions should boost the economy because they will reduce the amount by which the government interferes in private markets, and they will increase the incentives for the private sector to work, invest, and innovate.

Tax reform can deliver a stronger economy, and a stronger economy ought to make it much easier to reform Obamacare.