Monday, October 19, 2009
Rising confidence is driving equity markets higher
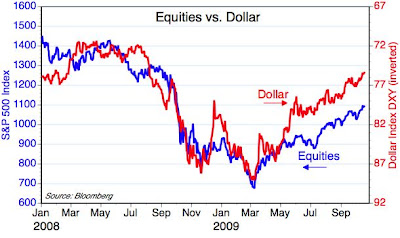
I've been highlighting these charts for a long time now. They both help to understand what is behind the gigantic rally in equity markets today. As I see it, the fuel for the rally is rising confidence. Confidence hit rock-bottom last March, but it is now coming back. The Vix index in the top chart is a good measure for the fear and uncertainty that inhabits the market, and the decline in the Vix has tracked the rise in equity prices quite closely. Similarly, the dollar has had a very tight, inverse relationship with equity prices because as confidence has come back and fears have been reduced, the world's safe-haven demand for dollars has declined. Dollars that were being hoarded under the mattress or in money market funds are being converted back to other currencies and/or being spent, and that is driving the rise in economic activity that we see all over the world. In other words, rising confidence is reducing the world's demand for dollars, at a time when the Fed is still very willing to supply them—that is a perfect prescription for a dollar decline and a reflation of economic activity and prices.
The stock market was priced to an economic catastrophe earlier this year, and it is now in the process of repricing to a less awful forecast for growth (my guess is that the market is now priced to tepid growth of only 2% or so). We could be headed for bubble territory (e.g., in equities, commodities and nondollar currencies), but I don't think we're even close yet. We're still working our way out of the depths of despair.
Subscribe to:
Post Comments (Atom)


7 comments:
Do you think the Home Builder sentiment decline is simply a short term blip....it appears housing is chugging along strong?
Inventory is running out in England and prices back to record levels.
The anecdotal evidence I'm hearing in So. California is that bidding wars for foreclosed properties are now routine, prices are firm and/or rising, and there is a general shortage of properties on the market.
Hello.
Another economist says current s&p discounts 4.8% growth, a big gap between 2% of yours. What do you think can affect the estimations so heavily?
Reading the market tea leaves is an art, not a science. There are all sorts of ways to guess what the market's expectation for growth is. My guess is driven by my observation of credit spreads and implied volatility, and by the tone of market commentaries and mainstream economists.
I think most observers pay too much attention to things like consumer demand, deleveraging, foreclosures, and unemployment, and not enough attention to market-based indicators of economic activity on the margin (e.g., commodity prices, swap spreads, the yield curve, and investment).
Finally, I think that a forecast of 3-4% growth is very conservative, considering how deep the last recession was--recoveries are almost always stronger when recessions are deeper.
Is there is an econometric method to estimate what rate of GDP growth the stock market is pricing in?
There are probably at least several methods. But in the end they are only as good as the assumptions one makes. Econometric models rely on key forecast assumptions, and they tend to stop working after a while, because the world is always changing.
Post a Comment