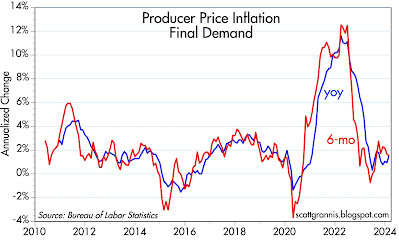
Today the Fed released the February money supply data, and there were no unwelcome surprises. M2 continues to shrink relative to the economy, and that's the reason inflation is likely to continue to fall.
Chart #1
Chart #1 shows the recent history of currency in circulation, which represents about 10% of M2. It rose at a fairly constant 6.6% annual rate from 2010 until early 2020, then surged (as did M2) from March 2020 through early 2021. I've assumed for years that this measure of the money supply is also a reliable measure of money demand, because people hold currency only if they want it. (Important note: there is no direct measure of money demand, and that's why it's hard for the Fed to keep the supply of and the demand for money in balance.) Any rational person with unwanted currency would simply return it to a bank in exchange for an interest-bearing deposit of one form or another.
So the message of currency is that the demand for money exploded in the wake of the Covid crisis; everyone wanted more cash because there was so much uncertainty. And besides, it wasn't easy to spend money back then if you couldn't leave your home. But things started changing in early 2021 with the introduction of vaccines. Life slowly started getting back to normal. The demand for money began to subside. Today, currency in circulation has fully reversed its "bulge," and is back on its 6.6% annual growth track.
Most important is the fact that if money supply and money demand are now roughly in balance, as seems to be the case, there is no reason to expect a meaningful change in inflation.
Chart #2
M2 grew at a 6% annual rate from 1995 through 2019. It then surged by some $6 trillion over the next two years, propelled by $6 trillion of government "stimulus" spending which was monetized. Deficit spending at all other times in recent history has been financed by selling Treasury debt. Not so this time, when the spending was effectively financed by newly-printed money.
The initial surge in M2 was not inflationary because, as currency in circulation tells us, the demand for M2 was intense in the first year of soaring M2. But as the demand for money began to decline in 2021, excess money became inflationary as people began spending their surplus cash. This, coupled with supply bottlenecks, created a classic "demand-pull" inflation: too much money chasing too few goods.
M2 growth since early 2022 has been flat to negative, thanks in large part to the Fed's belated decision to jack up interest rates. Higher interest rates made M2 money more attractive, effectively neutralizing in large part the huge excess of M2 at the time. Although there is still some "excess" money according to this chart, it is not a source of inflation because interest rates remain high: extra money supply is countered by the extra demand for money that results from high interest rates.
Chart #3
Chart #3 illustrates how changes in M2 growth tend to precede changes in the CPI by about one year. That relationship appears to have broken down over the past 6-8 months, however. I think the reason for that is that the CPI is being overstated by the way the BLS calculates shelter costs. The red asterisk shows the year over year change in the CPI ex-shelter (1.8%) as of February '24; that's much more in line with the growth of M2. And it further suggests we have continued disinflation in the pipeline since shelter costs are almost surely going to decline over the next 6-8 months.
Chart #4
Many will call this a "soft landing" or "no-landing" scenario. Because it will be the first time the Fed has wrestled inflation down from uncomfortably high levels without also triggering a recession. And the reason for that is the Fed's "abundant reserves" policy, which avoids creating a shortage of liquidity in the banking system.


