Chart #1
Chart #1 compares the number of job openings to the number of people looking for jobs. Rarely have openings exceeded the number of job seekers by as much as they have in recent years. What's wrong with that?
Chart #2
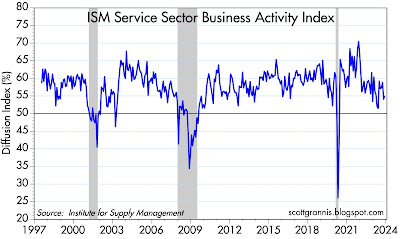
Chart #2 shows an index of service sector business activity. Conditions are still improving (almost 55% of businesses surveyed report improving activity). Things have been better, to be sure, but they would have to deteriorate materially to make me worry about a recession. In any event, this survey suggests that it's reasonable to expect the economy to continue to grow by, say, 2% per year. No boom, no bust.
Chart #3
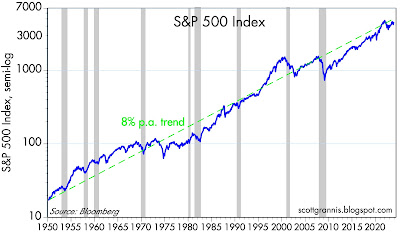
Chart #3 shows the S&P 500 index from 1950 through today. As any student of long-term stock market returns knows, equity prices tend to rise by about 8% per year on average (sometimes more, sometimes less). Add about 1.5% for dividend yields, and you get a long-term total return for equities of about 9.5% per year. Today's market looks pretty normal by those standards.
Chart #4
Chart #5
Chart #4 shows the yield on 10-yr Treasuries going all the way back to 1925. It's been a wild ride, to be sure, especially for the past few years, as yields rose by more and faster than at any time in history. Yields hit a low of about 0.5% in the midst of the Covid shutdowns in 2020, and have since risen to a high of 5%; today they closed at just over 4%.
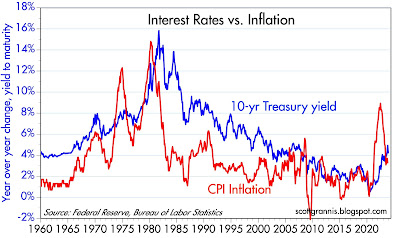
Chart #5 compares these same yields to year over year consumer price inflation from 1960 through today. If—as seems likely—the Fed succeeds in bringing inflation down to 2% or so and holding it there, there's no reason 10-yr yields can't trade in a range of 3.5% - 4%. We're pretty close to that already.
Chart #6
Chart #6 shows two very liquid measures of credit spreads (Credit Default Spreads). Credit spreads are notorious for moving up in advance of recessions and moving down as the economy recovers. That's because credit spreads are driven primarily by the market's outlook for corporate profits, which in turn is a function of the health of the economy. Right now credit spreads are only modestly elevated, which is consistent with a forecast of about 2% real economic growth.
Chart #7
Chart #7 compares the value of the dollar (white line) to the real yield on 5-yr TIPS (orange line). The two have a strong tendency to move together over time. Fed monetary policy is captured in the level of real yields (higher yields mean tighter policy). So a tight Fed means higher real yields, which in turn make the dollar more attractive. The dollar looks somewhat weak of late, and that probably means the market is expecting the Fed to ease policy over the next year or so. And in fact the bond market fully expects the Fed funds rate to be cut 5 times (125 bps) by the end of next year, with the first cut coming in the second quarter of next year. I wouldn't surprised to see the Fed cut rates at the March FOMC meeting, if not sooner. Real yields on 5-yr TIPS will probably be trading around 1% by the end of next year.


I guess you are saying the Fed has a few Phillips Curve believers.
ReplyDelete
ReplyDelete'No boom, no bust'. Thank you, Scott.
For those interested, there's a twitter account for "Milei in English. Translating Milei videos for friends. No politics. 100% Economics. " https://twitter.com/Milei_Explains
I use data as close to or over 100 years for "long term" market studies.
ReplyDeleteA major firm did a 20 year (overlapping) rolling interval study over 100+ years (writing this from memory, so I don't recall all the details), and found 8.85% average compounded total return for stocks. Over a similar range, CPI inflation was about 3%.
I think there is a major issue coming from entitlements/federal budget coming in about 10 years. If we would have a "real" recession now, we would clean up zombie businesses, possibly get some more prudence in govt spending, etc.- the benefits only a recession brings.
If not, the recession (big one) that comes due to what happens in the early 2030s will be even more difficult than necessary.
Thanks for the post.
Why are banks so gloomy on their economic forecasts for 2024?
ReplyDelete“ Why are banks so gloomy on their economic forecasts for 2024?”
ReplyDeleteShort answer: it’s easy to be gloomy these days. There are lots of things that are going wrong and that look bad. Biden’s policies are anti-growth and he is barely sentient; the Fed is tight and M2 is shrinking; interest rates have surged and the yield curve is inverted (both classic precursors to recessions); geopolitical tensions in the Mideast are running hot; China’s economy is slumping; major economies are aging rapidly; tax and regulatory burdens are punishingly high; US debt is close to 100% of GDP; consumers are still suffering from inflation shock; green energy subsidies are consuming massive amounts of scarce resources with no discernible benefit (i.e., global warming is a hoax); Maxist ideology has permeated our universities; the Deep State has reached monstrous size.
Faced with these realities, how is it possible to remain optimistic? I manage that difficult feat because I have an enduring faith in the power of free markets (yes, the US economy is still essentially one big free market despite its many constraints) to reward hard work and innovation, which in turn delivers prosperity and rising living standards. Another reason to remain optimistic: there are so many things that are wrong these days, and so many things that could be done better, that you have to be optimistic. In the absence of a police state, human nature and economic incentives all but guarantee that wrongs will be righted eventually.
"hard work and innovation, which in turn delivers prosperity and rising living standards. Another reason to remain optimistic: there are so many things that are wrong these days, and so many things that could be done better, that you have to be optimistic. In the absence of a police state, human nature and economic incentives all but guarantee that wrongs will be righted eventually. "
ReplyDeleteExactly. Government mismanagement (read over-regulating & over-taxing) are drags on any economy. The innovators and workers in private business are the "full faith and credit" of the US. They create the prosperity- usually in spite of the government. Americans are exceptionally good at this.
https://www.lemonde.fr/en/opinion/article/2023/09/04/the-gdp-gap-between-europe-and-the-united-states-is-now-80_6123491_23.html
A good read by Claudia Sahm arguing inflation was supply driven (and not due to the loads of money dropped by the Covid Rescue Plan).
ReplyDeletehttps://www.ft.com/content/33f9dbb0-c620-4cd7-a7dc-02e47fe28c11?sharetype=blocked
Chart #3 begins in 1950, a deeply under-valued moment in the market. What happens if you use a starting point from average valuations, or even over-valued as currently the case?
ReplyDeleteThank you, as always. What is the basis for 1% 5-year real yield? Do you think 5-year goes to 1% and 10-year stays around 2%?
ReplyDelete