The latest data from the housing market shows activity has been rather flat for the past year. Starts are still significantly below what might be considered "normal," but builder sentiment suggests there is room for improvement. Indeed, starts would need to rise significantly over the next several years just to keep up with scrappage and the ongoing rise in housing formations and population.
Housing prices, according to Case Shiller, are still well below their "bubble" highs in real terms. Meanwhile, mortgage rates are at historically low levels. Both suggest that there is lots of room for further growth.
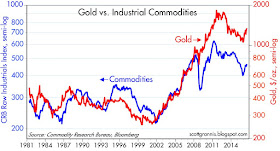
Both gold and industrial commodities have enjoyed a nice bounce since the end of last year. It's notable that the bounce in commodities has occurred even though the dollar has been relatively stable—usually it take dollar weakness to produce a healthy bounce in commodity prices. I'll chalk up the latest move in commodities to what appears to be a firming in global demand—a promising development given the doom and gloom which still pervades most markets (e.g., extremely low sovereign yields).
Sterling is the currency that has weakened the most of late, driven in large part by the perception that a "Brexit" will be a negative for the economy. I think it will work to the UK's advantage over time, but for now it just creates a lot of uncertainty. In any event, as the chart above shows, by my calculations the pound today is trading right around "fair value" vis a vis the dollar, after being quite strong for many years. If/when the UK adopts better trade agreements (freer trade), the pound has room to rise. But for now it's reasonably priced. Great time to take a vacation in the UK!
'
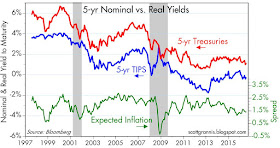
Beginning in early 2011, Treasury yields began diverging from core inflation. The significant gap between yields today and inflation is a sign, I believe, of a market that has very low expectations for economic growth and a great deal of risk aversion. As the second chart above shows, inflation expectations have declined by almost 100 bps since early 2011, but actual inflation has risen. This is a market that worries about slow growth and a Fed that is powerless to push inflation up. I think the market is underestimating the Fed's ability to deliver 2% inflation, since core inflation is already running above 2%, and it has been 2% or better for most of the past decade. I fully expect the headline CPI to register at least 2% by the end of this year. Bonds are definitely expensive at these levels.
2-yr swaps spreads in the US have moved up a bit so far this year, but they are still in the comfort zone (15-35 bps) that is consistent with healthy, liquid markets and low systemic risk. I note that the increase in swap spreads from almost zero to today's 21 bps has coincided with a stronger equity market. That makes sense if you consider that buying swap spreads (equivalent to buying AA-rated bank bonds) is a more attractive way to hedge against a weaker economy than buying Treasury bonds, due to the onerous capital requirements imposed on bank balance sheets (i.e., going long swap spreads doesn't consume capital the way going long Treasuries does). In other words, very low swap spreads were indicative of a market that was desperate for ways to hedge against a weaker economy. That swap spreads are more normal today means the market is less risk-averse, and we see that as well in rising equity prices.
The chart above tells the same story. The ratio of the Vix index to the 10-yr Treasury yield is a measure of fear and pessimism. It has dropped in recent weeks as equity prices have risen. But the ratio remains elevated, thanks to extremely low Treasury yields. This means the market is less uncertain about the future, but not very optimistic about the prospects for growth (i.e., the Vix is relatively low and Treasury yields are extremely low).
Arguably, the most significant macro development since 2008 is the huge increase in the world's demand for money, which is shown in the chart above. For decades the ratio of M2 to nominal GDP was relatively steady, but since 2008 it has soared to levels never seen before. This is indicative of a market that is still very risk averse, and it goes hand in hand with the significant deleveraging that has occurred in the private sector.
Even though M2 has grown much more than nominal GDP since 2008, the growth rate of M2 has been consistent with historical trends, as the chart above shows. There is no evidence here that the Fed has "printed" money in excess of what has been the historical norm. The Fed supplied more money to the system in response to a huge increase for the demand for money. There is nothing wrong with that! Without QE we would have been in a world of hurt: a shortage of money would have resulted in global deflation.
Bank savings deposits make up about two-thirds of the M2 measure of the money supply. Virtually all of the growth in M2 since 2008 is accounted for by bank savings deposits, and banks have "invested" most of that money in bank reserves (banks have lent almost $3 trillion to the Fed since the start of QE). Banks have been quite risk averse, and they have also had to deal with onerous capital requirements (e.g., Dodd Frank and Basel Accords). It's certainly possible that most or all of the increase in bank reserves was driven by much more stringent capital requirements.
The euro has been relatively weak vis a vis the dollar since mid-2014, and Eurozone equities and Eurozone growth have significantly underperformed their US counterparts over that same period. The US hasn't been very exciting of late, but the Eurozone has been even less so. By my calculations, the Euro is trading a bit on the cheap side vis a vis the dollar. It's hard to get excited about the Eurozone these days, and that helps explain why the Brits were so anxious to leave its embrace.


Nice review. New nominal highs on Wall Street.
ReplyDeleteCPI core minus shelter still dead. The Fed uses the PCE as its inflation gauge and it is running even lower.
Housing starts may be crimped for a long time due to Dodd Frank and property zoning. This will result in rising housing costs regardless of monetary policy.
Well, interesting times.
Good post as usual. I never understood the full value of technical charts until I discovered this blog.
ReplyDeleteGood afternoon,
ReplyDeleteCould you specify the source of PPP EUR/USD=1,17? Indeed, from the OECD website, they give EUR/USD=1,30
https://data.oecd.org/conversion/purchasing-power-parities-ppp.htm#indicator-chart
Thanks a lot for your help,
The PPP value of EUR/USD shown in the chart (1.17) is the result of my own calculations and judgment.
ReplyDeleteThank you for your answer. It's clear.
ReplyDeleteI take this opportunity to thank you a lot for your very interesting blog. I learn a lot from your analysis.
Regards,
Ben Cole:
ReplyDeleteI understand your hobbyhorse with regards to zoning -- as for Dodd Frank, not sure I get the idea. Banks usually don't hold on to mortgages anyway -- securitised instruments instead. The change in demand for housing could be caused by zoning, but if its true then 2003-07 should not have happened (right!)
No my guess is twofold: Millenials have neither the job security nor the inclination to "buy a house", mainly because they saw their parents suffer so much from the crisis. Moreover, with job insecurity the idea of buying an expensive, illiquid assets goes against the grain. finally, America is in the middle of a demographic shift.
Not to say that "build anything anywhere" is not a brilliant idea and a sure way to increase GDP, just thinking that it may not be the end all and be all solution to what is America's real problem. Add to the sauce a "crazed" political party that says" The country is going down the crapper, we should either jail or shoot (or maybe both) our political opponents! (did you happen to watch the GOP's little love fest...seriously listening to speaker after speaker talking about the end of the Republic...makes you wonder why anyone would be optimistic about the future).
Again, I have no real skin in the game, I am not American, but it would seem to simplify the world to Dodd-Frank and zoning rules would seem to be aiming for the wrong diagnostic. Sorry about the anti-GOP rant, its just very depressing to watch, considering that the US economy has not relatively good over the past 8 years -- maybe helicopter money was at the root cause, and yes wages are still depressed, but it remains that America is one of the few world economy that has positive economic growth, low inflation and very low unemployment (south of 5%).
Just saying
Frozen--
ReplyDeleteYes the GOP sludge-fest is dispiriting and the Donks are worse.
Judging from the convention, the GOP evidently plans prosperity through bellicosity, occupations and war...
DF and other regs have basically pushed lower-income buyers out of the housing market.
Property zoning is just bad economics through and through and now is resulting in world class NIMBYISM and housing shortages along the West Coast....
Stay tuned....
Lodging costs, as per Case Shiller, are still well beneath their "air pocket" highs in genuine terms. In the interim, mortgage rates are at verifiable low levels. Both propose that there is loads of space for further development. mortgage rates calgary
ReplyDeleteScott changed the blog photo. He is showing what should be the site of a 60-story condo tower.
ReplyDeleteBenjamin: clever!
ReplyDeleteBen Jamin, even Bloombag is joining your call to end
ReplyDeletezoning!
http://www.bloomberg.com/view/articles/2016-07-27/zoning-has-had-a-good-100-years-and-that-s-plenty
Even HansCastNow miscalculated the GNP annual growth
ReplyDeleterate running at pre-adjusted 1.2%.
Restaurants sales are declining as well. A precursor to
a recession?
Hans: Believe you me, if the West Coast unzones and the Fed sends in the helicopters, we see 20 years of robust GDP expansion....
ReplyDeleteTime was when the economy ran at 3% real growth and 3% inflation. Then we went to 2% inflation and 2% real growth. And now it appears we are happy with 1% growth and 1% inflation.
ReplyDeleteThe New Normal?
I hate to see the future...
Ben Jamin, inflation is taken so lightly verse even
ReplyDeletethe hint of deflation.
In a action of desperation, the Central "Crank" Bankers
will begin to purchase all government debt to keep the
their system from collapsing. (I better use the word monetizing)
World debt will not be paid off and monetizing will be the only
asset left for governmental units. I foresee double digit inflation
and very weak economic growth. There will also be social unrest
and increasing crime rates, as well.
Difficult times ahead for this Republic!
Also: Have you checked conditions in Venezuela where the printing presses are working overtime?
ReplyDelete