Thursday, March 24, 2011
Claims decline, but slow progress on the jobs front
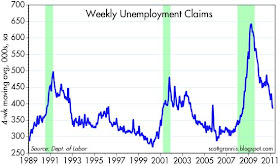
Fewer and fewer people are getting laid off these days, but the ranks of the unemployed remain large. As the first chart shows, first-time filings for unemployment claims have fallen rather dramatically in the past two years, signaling that U.S. businesses have accomplished the lion's share of the needed adjustments to a slower economy and an eviscerated housing market. This is as it should be during tough times, but we've been waiting for the other shoe to drop, which is a pickup in new hirings. To date there has been some progress, but hardly enough (1% annual jobs growth) to put a dent in the ranks of the unemployed. As the second chart shows, about 8 million people have been receiving unemployment insurance benefits since last summer. Companies are getting leaner and meaner, but what we really need to see is some meaningful expansion. That probably won't come until Congress takes substantive steps to curtail the runaway growth in government spending and entitlement programs. I think it's coming, but businesses understandably need some concrete evidence of federal belt-tightening before making new commitments to expand.
Government needs to step out of the way before business is going to step forward.


I wish there was some more strength in these numbers. The oil situation is not helpful, but mostly I sense Americans lost their confidence in the Bush years and never got it back. That may be Obama's fault, or it just may reflect the times.
ReplyDeleteCalifornia's 52 week moving average
ReplyDeleteof non seasonally adjusted jobless claims continues its decline (slowly)...lowest level since July
2009...
Plus... the 52 week moving average of non seasonally adjusted jobless claims is now at its lowest level
ReplyDeletesince January 17,2009....
This is from an outfit named Wyatt Research. Worth mulling over. QE3 anyone?
ReplyDelete"There should be no doubt that QE2 liquidity has found a home in the stock market. It seems inevitable that some kind of correction for stock prices will occur, assuming, of course, that the Fed doesn't signal that QE3 is right around the corner.
David Rosenberg, of Gluskin Sheff says we've already been given a roadmap of what will happen when QE2 ends: Last year, from April 23 through to August 27, the Fed allowed its balance sheet to shrink from $1.207 trillion to $1.057 trillion for a 12% contraction as QE1 drew to a close. During that time period, Rosenberg details, the S&P 500 sagged from 1,217 to 1,064. In addition, the S&P 600 small caps fell from 394 to 330."
So maybe we get a 20 percent correction on the DJIA when QE2 concludes. Sounds like a very bad idea to let QE2 conclude. Now is not the time for negative wealth effects.
Correlation is not causation. Other things were happening in the period Rosenberg references that likely account for the drop in equities. The European sovereign debt scare was a big one. Plus, quite a few indicators of economic activity suggest the economy slowed down during that period, confirming fears at the time that the economy was entering a double-dip recession. The lags between monetary policy and the economy are too long and variable to pin the equity market correction on a decline in bank reserves from an extremely high level to a slightly-less-than-extremely-high level.
ReplyDelete