Monday, November 9, 2009
Fear subsides, prices rise (14)
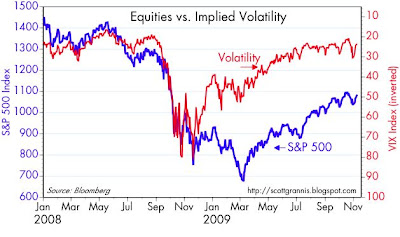
I've posted these charts numerous times this year because the enduring relationship between equities, the value of the dollar, and implied volatility has been so fascinating.
The first chart isn't so hard to understand: it basically says that equities do better as fear and uncertainty decline. That makes perfect sense—how could any asset market prosper if the future became less certain and more variable? In the past several months there have been several equity selloffs, each one accompanied by a spike in the Vix index, which is a proxy for the market's fears, doubt, and uncertainty. Since these selloffs have been driven by "panic," rather than by any change in the fundamentals, they have proved to be only temporary. I pointed this out most recently in this post.
The second chart is more difficult to understand. In fact, it's counter intuitive, since it suggests that a falling dollar is good for the stock market. For a supply-sider, that goes against all common sense. Supply-siders would normally view a strong currency as a necessary condition for a strong economy, since it reflects confidence, a willingness to invest, and a low-inflation outlook. So how can 8 months of a falling dollar (the dollar is down 15% against other major currencies and down 19% against gold) coincide with a 60% rise in the stock market?
The answer that ties everything together is that the big changes in the dollar's value since early last year have been a reflection of big changes in money velocity. The economic collapse of last year was largely driven by a huge and relatively sudden collapse in money velocity. Consumers and businesses alike were panic-stricken by fears of a collapse of the global banking system, so everyone stopped spending money and tried desperately to increase their holdings of money, by selling other assets and by paying down debt. Then we had the big collapse in the equity market that hit bottom in early March, and that collapse was driven by fears of a looming fiscal train wreck in the U.S. Once again fear drove investors to stock up on cash. The dollar ended up being the chief beneficiary of the world's desperate desire for safety and liquidity.
What we have seen since March is therefore the gradual return of confidence and the unwinding of flight-to-safety trades. Dollar cash is no longer so desperately desired, and we see evidence of this in a huge decline in the growth rate of dollar currency and M2 since March. This next chart documents the big slowdown in money growth which began at the same time as the equity market started to turn up last March. Note also the huge increase in M2 growth which started in Sept. '08, around the time of the Lehman bankruptcy.
Equities have turned up because the economy has been recovering from shell-shock. Cash is being spent again, and the economy is gradually recovering the ground that it lost last year. In economic terms, we are enjoying a rising velocity of money; in a sense, money that had been "stuffed under mattresses" is now being spent, and that is powering a rise in economic activity. Contrary to what many pundits are suggesting, I think equities are far from signaling a bubble—they are rising because the market is experiencing the equivalent of a big sigh of relief. In early March, markets were braced for a super-double depression and deflation. Now that it is clear that we are not going to fall into an economic black hole, risky asset prices are slowly returning to levels that, in my estimation, reflect the expectation of a run-of-the-mill recession.


"We are enjoying a rising velocity of money; in a sense, money that had been "stuffed under mattresses" is now being spent, and that is powering a rise in economic activity."
ReplyDeleteSeems like it is the case. I got this chart as of 08/2009 where the inverted initial jobless claims lead the velocity of M2 by 3 months:
http://emfin.com/images/charts/VM2IC.gif
Might be worth it to update... I will check it out on Bloomberg if I have some time later this afternoon.