Showing posts sorted by relevance for query walls of worry. Sort by date Show all posts

Wednesday, October 8, 2014

Stocks climb walls of worry

The bull market in equities has been underway for 5½ years, during which time the total return of the S&P 500 index has been an astounding 222%, for an annualized return of just over 23%. Obviously this can't go on forever. Over the long haul, the total return on equities has been around 8% per year.

Yet corporate profits are at record highs, in nominal and real terms, and in relation to GDP, and the classic precursors of recession (e.g., tight money, high real interest rates, and a flat or inverted yield curve) are so far completely absent. The PE ratio of the S&P 500 is 17.6, which is only slightly above its long-term average of 16. The rally could continue; it's arguably nowhere near bubble territory.

But there are so many things to worry about! Profits might be mean reverting, which could mean a big fall lies ahead; geopolitical tensions are historically high; the U.S. economy is still mired in the weakest recovery in history; President Obama's approval ratings are at an all-time low; Obamacare has thrown the healthcare and jobs market for a loop; Dodd-Frank is crippling the financial industry; Europe is flirting with its third recession in the past 7 years; Japan is still struggling despite massive monetary stimulus; emerging markets are being punished by a stronger dollar and declining commodity prices; the Chinese economic juggernaut is running out of steam; Ebola could become pandemic; QE3 is almost finished, and the Fed's next move is almost certainly going to entail higher interest rates.


The chart above compares the S&P 500 index to the ratio of the Vix index and the 10-yr Treasury yield. I think this latter is a good proxy for "walls of worry." The Vix index by itself is an excellent proxy for the market's level of fear and uncertainty (a rising Vix index means that options on equities are becoming more expensive, which in turn means the market is willing to pay more for options since owning options reduces ones' exposure to risk), while the 10-yr Treasury yield has been an excellent barometer of the market's confidence in the strength of the U.S. economy (Treasury yields fall as investors are willing to accept a lower yield in exchange for their safety, thus making them a refuge in times of weak or negative economic growth). The ratio rises as fear rises and confidence in the economy declines, and it falls as fear declines and confidence in the economy rises. For most of this year, the correlation between the S&P 500 index and the ratio of the Vix index to the 10-yr Treasury yield has been almost perfectly negative: -0.85. That's not surprising at all, but what is of interest is the number of times a significant rise in the Vix/10-yr ratio has coincided with a meaningful decline in equity prices (at least seven times in less that two years, by my count).

Yet each flare-up of worry has subsided, as the fears that worried investors failed to materialize and the U.S. economy kept on growing at a 2-2 ½% pace. In the absence of an actual recession, it's tough to keep the equity market down, especially since the alternative to being exposed to equity risk means giving up tons of yield (and in the case of going to cash, it means giving up yield entirely). The earnings yield on the S&P 500 is currently 5.7% (the inverse of the PE ratio) while the yield on nominally risk-free 5-yr Treasuries is a only 1.6% and the real yield on risk-free 5-yr TIPS is zero.

Despite the long list of worries, there is still no sign that the U.S. economy is about to roll over. Trillion dollar shots of stimulus and Quantitative Easing failed to stimulate growth, and a massive contraction of the federal budget deficit failed to kill growth. The U.S. economy so far has managed to almost completely ignore the weakness of the Eurozone economy and the big slowdown in Chinese economic growth. The U.S. economy is massive in size and over the years has proven to withstand all manner of difficulties (e.g., recall that 9/11 came very near the end of the 2001 recession).

Despite all the negatives, there are some fairly exciting things going on which at the very least could keep the U.S. economy from slumping.


The chart above shows the BLS' measure of job openings. It has jumped by almost 24% year to date, and now surpasses the peak in job openings prior to the last recession. This suggests the outlook for the economy is brighter since businesses are more confident in the future.


Thanks to new fracking technologies, U.S. crude oil production has surged by a phenomenal 60% in just the past three years (it's up almost 80% in the past 5 years), making the U.S. the largest producer of crude oil in the world. So much for "peak oil" and the decline of civilization as we know it. Meanwhile, all that new crude has created tens of thousands of new jobs and, as a welcome side-effect, has given us abundant supplies of very cheap natural gas, which in turn gives U.S. energy-intensive industries a huge leg up on their overseas competitors.


Since mid-January, just after the Fed announced the tapering and eventual demise of QE3, bank lending to small and medium-sized businesses (see chart above) has expanded at a 13.6% annualized pace. This reflects growing confidence on the part of banks and businesses. The tapering of QE (which is almost over) has not resulted in any reduction in the availability of credit. On the contrary.


As the chart above shows, every recession in the past 60+ years has been preceded by a significant tightening of monetary policy. Tight money shows up in high and rising real short-term interest rates (the blue line) and a flat to inverted yield curve (the red line). Today these two variables tell us that monetary policy is still very accommodative, and as such poses no threat to growth. It would take an awful lot of tightening to change that picture, and that is not likely to happen for at least the next 1-2 years.

And then there is the prospect—increasingly likely—that the Republicans take over control of the Senate after next month's elections. At the very least this could be the high-water mark for Big Government. In the years to come we could see regulatory burdens declining instead of increasing; marginal tax rates could ease instead of becoming ever-more burdensome; corporate tax burdens could decline, allowing U.S. corporations to better compete in the world and attracting rather than repelling capital.

In the meantime, as long as the U.S. economy avoids recession, equities are likely to continue to climb recurring walls of worry.

UPDATE: Below is an updated version of the first chart in this post as of the market close on Oct. 10th. The equity selloff has intensified, and the wall of worry has risen.


UPDATE 2: An updated version as of the morning of Oct. 14th. The "wall of worry" has attained impressive levels, with lots of worries about slower growth dragging 10-yr Treasury yields to new lows for the year, while the Vix soars to the mid-20s, propelled by geopolitical tensions and the spreading Ebola crisis.


UPDATE 3: Here's a chart update as of Oct. 21st (am). Fears are receding and stocks are rising. It's been all about fear, since (so far) there has been no deterioration in the economy's fundamentals.


Thursday, January 29, 2015

Walls of worry persist

The market is still climbing walls of worry, and that's a good sign.

As I see it, here's the bearish case for equities: The Fed is no longer "printing money" and is soon going to begin to raise short-term interest rates. The market has enjoyed a great party for years, but the Fed is about to take the punchbowl away. Equity valuations are stretched, and earnings reports are turning mixed. The energy sector has been savaged, and there may well be nasty ripple effects: layoffs and defaults. China is in a slump and over-burdened with debt. Europe is in another slump and no amount of QE is going to make things better. Countries all over the world are trying to devalue their currencies in the hopes this will boost exports—but that's a fool's game. Policymakers have run out of tools to stimulate growth; growth is likely to be meager for the foreseeable future. The market's enthusiasm is likely to founder on the rocks of slow-growth reality.

In contrast, here's what I think the bullish case for equities is: QE was never about printing money; it was mainly about transmogrifying notes and bonds into T-bill substitutes in order to accommodate the world's demand for safe assets. Confidence is returning, however, and demand for safe assets is declining, so ending QE was the right thing to do. The economy still has plenty of unused capacity, but growth has definitely picked up in the past year. Congress is very unlikely to raise taxes, and may even succeed in lowering them, especially for corporations. Regulatory burdens are more likely to lighten than to increase further. Even if interest rates start moving up soon, they will still be very low relative to inflation for a long time. Equity valuations are no longer cheap, but relative to the yields on safer assets, equities still look quite attractive. There are still plenty of signs that the market is cautious, and that worries are more prevalent than exuberance. Absent a recession—which looks unlikely—equities are likely to outperform most other asset classes because of their superior earnings yield.

Here's how I read some of the more important market-based tea leaves:


The chart above represents the yield menu that investors have to choose from. If you don't want to bear any risk, you are not going to earn anything on cash. Cash (and cash equivalents such as 3-mo. T-bills) yields zero because the demand for safety is extremely strong. The market seems indifferent between owning equities with an earnings yield of about 5.5% and owning cash, with a yield of zero. That can only be taken as a sign that the market is still quite risk averse.


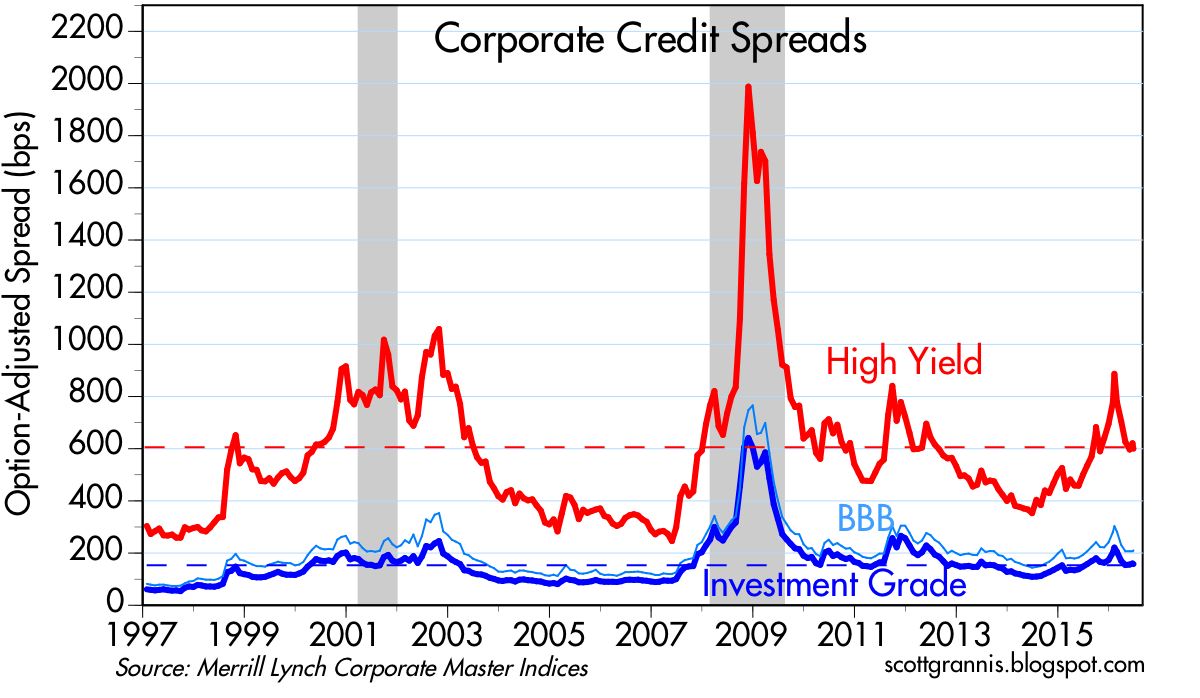
Risk aversion can also be seen in the chart above, which shows that spreads on corporate bonds have risen meaningfully from their recent lows. When confidence and the appetite for risk are strong, spreads are tight; that is not the case today. But doesn't the recent rise in credit spreads signal a coming recession? I don't think so, since swap spreads—the best leading indicator of economic and financial trouble on the horizon—are still quite low. Systemic risk is low, but there's still a lot of worrying going on, and that makes for a healthy market environment. The time to get really worried is when the market is priced to perfection. As it was in early 2000, when the economy was expected to grow 4-5% per year indefinitely.


The chart above shows that the market has been climbing walls of worry (worry being quantified here by the ratio of the Vix index to the yield on 10-yr Treasuries) for most of the past several months. The Vix index is high, which means investors are willing to pay up for the relative safety of options. The 10-yr Treasury yield is quite low, which means investors don't expect the economy to be very strong.


The chart above shows that the earnings yield on equities is significantly higher than the yield on 10-yr Treasuries. This is a clear sign that the market worries that the outlook for corporate profits is troublesome, to say the least. During times of strong growth (e.g., the 1980s), the earnings yield was well below the yield on 10-yr Treasuries. The equity risk premium has been unusually high for several years, during which time equity prices have marched continually higher. It's been climbing walls of worry all the way up.


The chart above compares the earnings yield on equities to the price of 5-yr TIPS (I use the inverse of their real yield as a proxy for their price). When the price of TIPS peaked in 2012, that was a sign of extreme risk aversion: the market was willing to pay a huge price for the relative safety of TIPS, which are default free and inflation-protected. At about the same time, the earnings yield on equities was also at or near a peak, which reflected great distrust concerning the outlook for corporate profits. In the past few years, demand for TIPS has weakened and confidence in the future of corporate profits has improved. But both are still far from where they would be in "normal" times. The market has become less fearful, but it is still somewhat risk averse.


As the chart above shows, it's unusual for the earnings yield on equities to exceed the yield on BAA corporate bonds, as has been the case for the past several years. Bonds are senior in the capital structure to equities, so they should normally yield more, especially since they don't have the upside price appreciation potential that equities do. Today's level of yields suggests that the market is still willing to "pay up" for the relative safety of bonds.


The prices of gold and 5-yr TIPS have been declining for the past two years, as shown in the chart above. (Here again I use the inverse of the real yield on TIPS as a proxy for their price.) Yet both are still high from an historical perspective. The demand for these two unique assets has weakened as the market has regained some confidence in the future, but they are still relatively expensive. The inflation-adjusted price of gold over the past century has averaged almost $600/oz., which is half of today's price. The average real yield on 5-yr TIPS since 1997 is about 1.4%, which is substantially higher than their current real yield of -0.2%.


As the chart above suggests, the real yield on TIPS should tend to track the real growth potential of the U.S. economy. GDP growth has picked up over the past year or so, and real yields have moved higher, both of which are good signs. But real yields remain quite low relative to the almost 3% rate of real growth over the past two years. That's a sign that the market is dominated more by worries than by exuberance.

Monday, June 20, 2016

Walls of worry update

For the past several years the economy has been disappointingly weak (the weakest recovery ever), and the stock market has periodically worried that things would get worse. The one reassuring constant in recent years has been 2-yr swap spreads, which have been low and relatively stable, thus casting doubt on the validity of the market's concerns. Nothing much has changed of late. 


The chart above shows how peaks in the market's level of fear, uncertainty and doubt (as proxied by the ratio of the Vix index to the 10-yr Treasury yield) have coincided with lows in stock prices. As fears rise, stock prices decline, and vice versa, as the market "climbs walls of worry." I've now labeled the fits of fear/walls of worry, to help with the analysis. The latest bout of fear has centered on the fears surrounding a possible UK exit from the European Union (aka Brexit). As polls and betting markets show the probability of a Brexit declining, markets have breathed a sigh of relief and stock prices have bounced.


If a Brexit spells bad news for the U.K. and the rest of Europe—I'm not convinced it does, but the market thinks it does—it stands to reason that a Brexit would hurt the Eurozone economy more than the U.S. economy, since U.S. exports to the Eurozone are a small fraction (~10%) of our total exports. And as the chart above shows, Eurozone equities have suffered significantly in the past year, whereas U.S. equities are relatively unchanged. In fact, it's not just a Brexit that is weighing on the fortunes of the Eurozone, it's long-term economic stagnation. I note that Eurozone equities have been underperforming their U.S. counterparts for quite a few years: since mid-2010 the S&P 500 is up almost 50% relative to the Euro Stoxx index. This alone suggests that the UK might be better off if unconstrained by EU shackles.


The chart above compares the price of gold to the price of 5-yr TIPS (using the inverse of their real yield as a proxy for their price). Both are go-to investments for those worried about rising inflation, geopolitical risks, and the end-of-the-world-as-we-know-it. Gold is impervious to the elements, and TIPS are not only impervious to inflation, they are the only security that offers a U.S. government-guaranteed real rate of return. Both prices have jumped in the past 5-6 months, no doubt encouraged by Brexit worries, general economic slowdown worries, terrorist attacks, and rising geopolitical concerns. But in the great scheme of things, prices of gold and TIPS are still lower than they were in 2011-2012, during the height of the PIIGS crisis. Things are bad, but not that bad.


The real yield on 5-yr TIPS is not only a measure of the market's inflation general instability concerns. As the chart above shows, real yields tend to follow the trend growth rate of the U.S. economy. When the economy was chugging along at 4-5% rates of growth in the late 1990s, TIPS carried a monster real yield of about 4%. With the economy growing at 4-5% per year, TIPS had to compete by offering a real rate that was somewhat less (because it is guaranteed). Now that the economy has been growing just over 2% per year for the past several years, TIPS real yields are trading at about 0%. You can lock in a zero real rate of return with TIPS, or you can take your chances with an economy that only promises to deliver 2% (which presumably sets a reasonable expectation for real returns on stocks). Not much has changed in this picture of late.


Bouts of fear are also reflected in credit spreads, which hit all-time highs in 2008, and lower highs during the PIIGS crisis and the recent collapse in oil prices. They are still somewhat elevated, which suggests the market is still concerned about a weak economy getting somewhat weaker. But they are far from panic levels. Oil prices are up, oil patch credit risk is way down, and the U.S. economy still appears to be growing, albeit still slowly.


The chart above is one I've showed many times over the past 7-8 years. It compares 2-yr swap spreads to high-yield credit spreads. I think it shows that swap spreads are good leading indicators of credit spreads and the health of the economy. They rose prior to the past two recessions, and declined prior to the start of the past two recoveries. They tend to rise before other credit spreads rise, and they tend to fall in advance of a decline in other spreads. 

Throughout the recent oil-price-collapse crisis, swap spreads have remained quite low. I argued several times in the past six months that the message of swap spreads was very encouraging. Low swap spreads are indicative of healthy financial conditions—lots of liquidity and very low systemic risk. Healthy financial markets serve as a shock absorber for the real economy. Functioning and liquid markets facilitate the myriad adjustments that market participants make while coping with changing economic realities. The swap spread market was telling us all along that the crisis in the oil patch was going to be resolved without great calamity, and indeed that looks to have been the case.


Finally, the chart above, which compares U.S. and Eurozone swap spreads. U.S. markets are in somewhat better shape than their Eurozone counterparts, but neither market is pointing to a significant negative event on the horizon. That further suggests that the Brexit fears will eventually pass, and the market will successfully climb one more wall of worry.

Tuesday, December 16, 2014

Walls of worry update


The equity market is now in the midst of what looks like another wall of worry. The last wall of worry was all about Ebola, while this time around the market is worried about the collapse in the price of oil—down almost 50% since last June—and how that is affecting major oil producers, notably Russia, whose currency has lost about 50% of its value over the same period. This all amounts to a tremendous amount of change in a relatively short period, and that's enough to make anyone nervous. 

As the chart above shows, the ratio of the Vix index to the 10-yr Treasury yield (a proxy for fear and uncertainty) has spiked almost as much as it did during the height of the Ebola panic. The equity market hasn't sold off quite as much yet, however, but it's not hard to imagine that the oil panic and surrounding uncertainty will take some time to digest. 

Oil prices won't stop falling until producers cut back and/or consumers boost their oil consumption. That won't happen instantly, unfortunately. But there is little reason to think that prices are going to go down a black hole, and there's little reason to think that the world's oil consumers are going to decide to consume less now that oil is so much cheaper. It's easy for producers to halt new exploration, and it would seem that a halving of the price of oil ought to make a lot of wells unprofitable enough for their owners to shut down production, at least enough to chip away at the current oil glut. 

I note that the world survived an even greater oil supply shock in 1986, when the price of crude fell from $29/bbl in early 1986 to $8/bbl by mid-1986. It then bounced back to $18 by the end of the year. Nevertheless, that was a collapse of over 70% in a six-month period, and the world didn't end. GDP growth slowed briefly to 2.1% in the second quarter of 1986, but went on to post 3% growth for the year. I also note that the U.S. economy today is far less dependent on oil than it was in 1986. Oil consumption per unit of output has declined by over 40% since 1986, in fact.

UPDATE: For comparison purposes, here's an updated version of the "walls of worry" chart, as of the close of the market 12/17:


The inverse relationship between the market's fears and the price of stocks is remarkable. Fears peaked yesterday and subsided substantially today, mostly after the release of the FOMC minutes which revealed that the Fed has not changed its policy intentions. In addition, oil prices and the ruble bounced, both suggesting that yesterday's panic was overdone. Result: stocks rose 2%.

UPDATE1: As of the close of the market 12/18: the market now thinks that the big decline in oil prices is perhaps not so bad after all. Plus, the FOMC is behaving predictably, so uncertainty has subsided. Result? Another drop in the Vix/10-yr ratio, and a surge in stock prices:


I find this fascinating.

UPDATE2: As of the close 12/22, the level of fear is down further (though till elevated) and the S&P 500 is at a new all-time high.


Monday, August 24, 2015

Climbing an oil-slick China wall of worry

Falling oil prices and Chinese growth concerns have come together in perfect-storm fashion to send global financial markets into crisis mode. As I mentioned last week, what's going on seems to have more to do with fears than with any deterioration of the economic fundamentals. It's one more in a series of "walls of worry" that the market struggles to overcome—only this time it's an oil-slick wall of worry which makes the climbing more difficult.

It's impossible to say whether the global economy will unravel—sending shares lower still as the fundamentals finally do deteriorate—but the market seems to be pricing in a good chance of such a possibility. If you're going to panic and sell here, you need to be very worried that we are on the brink of a global economic disaster.


Crude oil prices have now fallen by almost 60% from last year's high. They've gone from being very expensive to now a bit cheap from a long-term historical perspective. I'd also note that virtually all recessions in the past 45 years have been preceded and/or triggered by relatively high prices of oil in real terms. With oil prices now into their second year of decline, we've seen only a brief slowdown in GDP, so I'm tempted to say that lower oil prices now make the economy less susceptible to a recession going forward. Cheaper oil is bad for producers, but very good for almost everyone else.


The key risk factor is how vulnerable the balance sheets of oil producers are to today's low prices. High-yield energy bond credit spreads are one way to evaluate that risk, and not surprisingly, they are high and worrisome. Nevertheless, the losses sustained by these bonds to date represent less than 1% of the value of all traded U.S. corporate bonds. This oil "tail" is unlikely to wag the corporate/economic dog, but that assertion does little to soothe a market that worries we're on the brink of another global recession.


As before, I think this chart is key. Despite the huge decline in oil prices, a substantial increase in high-yield credit spreads, and the recent 10% drop in equity prices, swap spreads are relatively low and declining. This is a stunning (and very reassuring) disconnect. If we were truly on the brink of another recession, swap spreads would almost surely be high and rising—but they're doing just the opposite. This lack of confirmation (the swap dog that didn't bark) points squarely to the current market rout being driven much more by panic than any deterioration in the economic fundamentals. The current level of swap spreads tells us that markets are very liquid and systemic risk is low. A big economic disruption is thus unlikely.


It's notable that oil's most recent decline has coincided with a decline in the value of the dollar. On a long-term time scale, oil prices tend to correlate inversely to the value of the dollar, as the chart above shows. I continue to believe that recent action tells us that lower oil prices are the result of a supply shock (think fracking) rather than overly-tight U.S. monetary policy. It's not a shortage of dollars that is depressing oil prices, it's a surfeit of supply, and that's good news for consumers.


The most welcome impact of falling oil prices is lower inflation expectations, as seen in the chart above. The market now expects the CPI to average about 1.1% over the next five years, mainly because of sharply lower oil prices. But when the bond market looks past the current oil decline, it sees the CPI averaging 1.9% over the subsequent five years—that's the message of 5-yr, 5-yr forward inflation expectations built into TIPS and Treasury prices. That's very much normal.


It's also notable that the prices of 5-yr TIPS (using the inverse of their real yield as a proxy) and gold  have barely budged despite the recent global equity market turmoil. This is one of those scare scenarios that has caused large equity portfolio managers to hit the "sell" button—not a generalized unraveling of the global economy or financial markets.


The last time we saw a wall of worry this high was back in September 2011, when the PIIGS crisis reached its apex. Unlike today, however, swap spreads were high and rising in late 2011, as the world not only worried about the health of the Eurozone economy but also the health of the Eurozone banking system. Today, despite the huge increase in the Vix/10-yr ratio, swap spreads are low and declining.


U.S. and Eurozone equities suffered much greater losses in late 2011 than they have in the recent selloff. They rebounded nicely once the PIIGS crisis proved to be not so dangerous, and they can rebound again if the global economy fails to collapse.

And, by the way, US exports to China are only 0.7% of our GDP, so the health of the US economy is not terribly dependent on the health of the Chinese economy.

Thursday, August 20, 2015

Cheaper oil does not spell doom

Once again, the world is in a tizzy as falling oil prices threaten the profits of the energy sector, which in turn sparks fears that this could spread to the rest of the economy. Once again, I think these fears are overblown. Putting things in perspective, oil prices in real terms are only slightly below their long-term average. The energy sector has taken a real hit, but the evidence of contagion is still hard to come by. Swap spreads remain low, and that suggests that markets are liquid and systemic risk is low, so even though the pain and suffering is acute in the energy sector, the rest of the economy looks fine. 


Credit spreads in the high-yield energy sector are quite high, suggesting a meaningful risk of widespread defaults. The average bond in this sector has suffered a 25% drop in price, erasing a total of about $40 billion of the sector's value. That's not chump change, but neither is it an existential challenge to a market (high-yield corporate bonds) with a total market value of $1.3 trillion. Meanwhile, the market value of investment grade corporate bonds is about $5.4 trillion. So the losses in the HY energy sector represent about 0.6% of the value of all traded corporate bonds in the U.S.


The decline in oil prices in the past year has been deep and precipitous, but when viewed from an historical context, all that has happened is that oil has gone from being very expensive to about average.


The chart above suggests that the main reason for the decline in oil prices is a giant increase in U.S. crude oil production. When greater supplies result in lower prices, that is a very good thing for consumers. 


As the chart above suggests, monetary policy is not the main culprit behind lower oil prices. We're not talking about a generalized deflation which is the by product of overly-tight monetary policy. The dollar is trading at very close to its long-term average, and so is crude. The dollar has been relatively stable for most of this year, even as oil prices have gyrated. The Fed is not about to "tighten" monetary policy anytime soon (one or two hikes in short-term rates doesn't equate to a tightening—it's just the Fed making policy less accommodative), so there likely is no fundamental shortage of dollars in the world, and no reason therefore to think that all prices are at risk of declining.


Corporate credit spreads in general are elevated, but still far less than they were during periods of recession.


The difference between junk and investment grade spreads is also elevated, but still relatively low compared to periods of great financial and economic stress.


The chart above is key: while credit spreads have risen meaningfully, swap spreads have remained in "normal" territory. Real problems happen when swap spreads rise by a lot, at the same time other credit spreads rise. That's not the case today. Swap spreads are not confirming the supposed contagion risk of defaults in the energy sector. They are saying that the contagion risk of lower energy prices is well contained.

In the chart above we see that 5-yr swap spreads are also quite tranquil, even though spreads in the high quality industrial sector have jumped. 


So the current bout of fear and trembling is likely to pass. The market is once again climbing a "wall of worry," worrying about something that has a low likelihood of become a serious problem. This is most likely a correction, not the beginning of another recession.


Those who worry about the value of risky assets must forgo a considerable amount of income in exchange for the safety of cash, as the chart above shows. This is symptomatic of a market that is still quite fearful in general. In effect, the market has priced in a substantial amount of bad news already.


The main impact of lower oil prices has been on inflation expectations, as shown in the chart above. This is how it should be.


For all the fear and trembling out there, gold prices have only managed a minuscule bounce, and real yields on TIPs have been in a rising trend for several years. This chart is not signaling any major problems.

Most importantly, rising real yields and very low swap spreads suggest that the economic fundamentals are improving, not deteriorating.

UPDATE: Here's what the "Wall of Worry" chart looks like as of 10 am PST Aug 21:


We've climbed walls of worry like this one before. I suspect we'll do it again.

Tuesday, January 10, 2012

Climbing walls of worry: update

There are two ways of looking at the upward progress of equity prices since last summer. For optimists, who see the glass as half full, the market is gradually shedding some of the panic that gripped the world when the risk of Eurozone sovereign debt defaults started to look inevitable. For pessimists, who see the glass as half empty, the market is once again levitating on the fumes of optimism, poised to crash once again as the global economy collapses in the wake of Eurozone defaults (or the second down leg of the US real estate market, or the collapse of the Chinese economy—or all three, take your pick). I'm in the optimists' camp, of course, because as I have been pointing out repeatedly there is plenty of evidence that the market is priced to some dire expectations. Like all true bull markets, this one has been climbing walls of worry for most of the past three years. This is not a market driven by optimism, it's a market that has had to overcome several major bouts of fear and trembling in recent years, and it's still plenty worried about the future.


To begin with, this chart shows how the level of unemployment claims—a proxy for the underlying health of businesses—has been leading the equity market higher. Businesses are firing fewer and fewer people because they have cut costs to the bone, leaving them well-prepared to cope with any future adversity. You can't have a legitimate rally if the fundamentals are not improving.


The Vix index, which measures how much investors are willing to pay to reduce their risk (because it reflects the cost of owning options, which is less risky than owning the assets underlying the options), is a good proxy for the market's level of fear. As the above chart shows, major selloffs in equity prices have typically been driven by increased fear, and rallies by decreased fear.


But even though the Vix has dropped significantly from last summer's peak, it is still elevated from an historical perspective. Plus, 10-yr Treasury yields, which are a good proxy for the market's expectation for long-term economic growth, are still trading at extremely low levels—lower even than at the end of 2008 or during the depths of the Depression. The combination of the two, shown in the chart above, reflects a market that is still somewhat fearful, while having given up almost all hope for a return to decent economic conditions. Call it fearful despair. Moreover, there is still plenty of room for fear and despair to fade away, before we might say that the market has become priced to something resembling optimism.


As the first chart above shows, the PE ratio of U.S. stocks is still at very depressed levels. That PE ratios can be substantially below their long-term average at a time when corporate profits are booming (after-tax corporate profits are now at record levels both nominally and in terms of GDP) can only mean that the market is priced to the expectation that profits will collapse in coming years.

In conclusion, the market is still priced to very pessimistic assumptions about the future. What this means for investors is that lots of very bad and terrible things would have to happen to undermine the current level of valuations. If the world can just avoid another calamity, then risk asset prices can continue to rise.