Thursday, July 28, 2022

Recession Lite


Real GDP declined for two quarters straight, and most would agree that meets at least one condition for a recession call. I would prefer to call it a Recession Lite.

Over the course of the first six months of the year, real GDP declined by 0.63%. On an annualized basis, that works out to -1.25%, which by the standards of past GDP revisions (which can easily be on the order of ±1-2%), is arguably statistically insignificant. But it does seem clear that the economy is in a bit of a funk, most likely due to high inflation, so it would be fair to say we are (once again) experiencing Stagflation.

Chart #1

Chart #1 is my contribution to understanding what's going on with the economy. I don't think you'll see this anywhere else. Let me first note that the y-axis is logarithmic, which makes steady growth rates look like a straight line. The blue line is inflation-adjusted GDP, in 2012 dollars (the dollar was worth about 22% more back then than it is now). The green line shows what the path of GDP would have been if the 40-yr trend from 1966 through 2007 were still in place (during which period the economy grew on average about 3.1% per year). The red line shows the 2.2% annual trend which has held since mid-2009. 

Today the economy is only about 2.2% below its most recent trend, but it is a gigantic 26% below its long-term trend. The big question we should be asking is why the economy is so far below a trend that persisted for 40 years and which suddenly disappeared following the Great Recession. Demographics likely played a role (an aging population), and globalization likely resulted in the export of lots of traditional jobs to other countries. But those factors don't change overnight—they change over many years. So I'm more inclined to point the finger at politics: increased regulatory burdens, huge deficit spending, and rising tax burdens, all of which create headwinds to growth.

In any event, this year's modestly disappointing economic growth hardly justifies dramatic changes in policy. Since the inflation we are suffering today has its roots almost exclusively in massive deficit spending in 2020 and 2021, the last thing Congress should do is spend more money that must be borrowed (or, perish the thought, printed). And since incentives to work, invest, and take risk are the lifeblood of productivity, the last thing Congress should do is raise taxes on anyone, since higher taxes reduce the incentives to work, invest, and take risk. And since any good economist knows that businesses don't pay taxes, Congress should not even consider raising the corporate income tax rate. If a business is taxed more it must pass the tax burden on to its shareholders, employees, and customers—otherwise it will go out of business. Taxing business is just an indirect—and very inefficient—way of taxing everyone. 

Joe Manchin, are you listening? That deal you just signed on to violates economic reason.

Recession Lite seems like an apt descriptor for today's economy, because a lot of the ingredients of a true, painful recession are missing. Jobs are growing by leaps and bounds (about 400K per month so far this year!), job losses are low, job openings are at stratospheric levels, industrial production is rising, capital spending is rising, the volume of world trade is at a new high, the stock market is recovering, and Covid-19 is yesterday's news.

Tuesday, July 26, 2022

More good M2 news


Today's June M2 release brought more good news: the M2 money supply in June was lower than its May level, and M2 has only increased at a very slow 1.7% annualized rate in the past six months. This all but ensures that inflation pressures have most likely peaked and year-over-year inflation will be falling by the end of this year, if not sooner. Slow money growth also is good news for the economy, since it means the Fed will not need to tighten nearly as much as the market seems to fear—and that, in turn, dramatically reduces the risk of a near-term recession.

The current episode of Fed tightening that we are living through is fundamentally different from all the others. Why? Because the excess money creation that fueled the surge in inflation over the past year was a one-off event that was tied directly to the trillions of dollars of fiscal "stimulus" that politicians pumped into the economy in the wake of the Covid lockdowns. As I remarked her two years ago, "The shutdown of the US economy will prove to be the most expensive self-inflicted injury in the history of mankind." And indeed it has proven thus. Not only was it futile—respiratory viruses cannot be contained by any known means, and masks are not only useless but unhealthy, especially for children—it was extraordinarily expensive since it thoroughly disrupted the world's major economy and was indirectly responsible for a worldwide surge in inflation whose consequences will be felt for many more months to come.

The Fed was guilty of tolerating a huge expansion in the money supply for too long, but Fed policy did not create it; massive fiscal deficits did. And since those deficits have all but disappeared, the money supply is coming back to earth. Monetary conditions have effectively tightened with only modest increases in interest rates.

In the past, the Fed tightened monetary policy by reducing the supply of reserves to the banking system. By making money scarce, the price of money rose (i.e., interest rates rose). Higher interest rates tend to slow the growth of money and slow the pace of inflation, but a forced scarcity of money typically led to myriad pernicious effects. It shuts off the flow of credit to businesses and households, ultimately resulting in bankruptcies and a collapse in the housing market.

Today's "tightening" features only higher interest rates. Monetary liquidity is still abundant, and credit spreads (leading indicators of bankruptcies) are only moderately elevated. A doubling of mortgage rates was almost immediately accompanied by a cooling of the housing market; those looking to buy a house found that the cost of doing so was suddenly much more than they could afford, so they pulled back and prices in many areas have subsided. Banks didn't stop lending so much as people stopped borrowing. 

Chart #1

Chart #1 shows the 6-mo. annualized growth rate of M2. The massive money-printing episode which gave us 10% inflation is now history. The Fed didn't have to do much if anything in the way of tightening to get this result, since it was mainly the fault of politicians who showered the economy with money.

Chart #2

Chart #2 shows the level of M2 relative to its long-term trend growth rate of 6% per year. The gap between the two has narrowed this year and will continue to do so. 

Chart #3

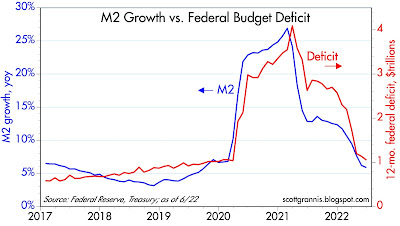
Chart #3 compares the year over year growth of M2 to the level of the federal budget deficit. It's overwhelmingly obvious that the deficit was the source of the surge in M2. But the deficit in the past 12 months has subsided to a "mere" $1.05 trillion, down dramatically from a peak of over $4 trillion. The money you received in stimulus checks in 2020 and 2021 was hot off the printing press, and that is why we have so much inflation today. Thank goodness it's now a thing of the past.

Chart #4

The bond market has figured this out, fortunately. As Chart #4 shows, the market expects CPI inflation to average about 2.5% per year over the next five years. The Fed doesn't have to do much more, since a solution to our inflation problem is already baked in the cake, so to speak. 

Chart #5

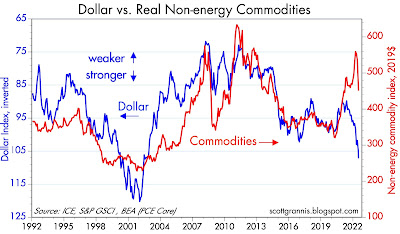
The commodity markets have reacted as well to the changing monetary conditions. Virtually every commodity has fallen significantly from its recent peak. Meanwhile, the dollar has been strong throughout, which implies that the US economy is in fundamentally good shape, especially compared to other economies. 

Chart #6

Chart #6 is critically important, since it shows that liquidity conditions (as measured by 2-yr swap spreads, which currently trade at the very reasonable level of 23 bps) in the US economy are excellent. There is no shortage of money; markets are liquid, and that is almost a guarantee that we are not staring into any abyss these days. The Fed hasn't really tightened at all, and the banking systems is functioning normally. The economy is working off the excess of M2 in a healthy, non-threatening fashion. 

Chart #7

I can't resist featuring a few charts from Argentina, a country I have known and followed closely for the past 50 years. Argentina is where I first learned about how inflation works. Click here for a synopsis. Argentina has had a long and tragic history of high inflation, and it couldn't get much worse than it has been in recent years. As Chart #7 shows, Argentina's money supply grew at a 30% annual rate from 2010 through 2020; since then it has grown even faster—in the past 12 months, in fact, it has surged by almost 70%! 

Years and years of money printing has given Argentina a lifetime of high inflation episodes of what might be termed hyper-inflation. (I was there to witness a bout of hyperinflation, in which prices doubled in the span of three weeks.) 

Chart #8

Not surprisingly, all that money printing has destroyed the value of the peso. As Chart #8 shows, the Argentine peso has lost fully 99% of its value vis a vis dollar since early 2007. The black market exchange rate(aka the "blue" rate) has collapsed to well over 300, far below the official rate of 130. This can't go on much longer, but I wish I knew what comes next. I would certainly agree with Steve Hanke that Argentina's only salvation is to dollarize its economy, but that is unlikely since it would mean that politicians would have to balance the budget in an honest fashion. But who knows, desperate times usually result in desperate measures.

In any event, it's greatly comforting to see that the US money supply grew at a 30% rate only briefly, and the US dollar remains one of the world's strongest currencies.


Tuesday, July 19, 2022

Dancing couple update


Still in Italy, so this is a quick update to my June 30 post which highlighted the amazing correlation between the price of bitcoin and the S&P 500. The correlation persists, and I am still searching for an explanation for what's going on.


The chart is an update of the one shown in my June 30 post. To recap, the orange line is the price of bitcoin, and the white line is the S&P 500 index. Note the tight correlation between the two for the past several months.

Wednesday, July 13, 2022

Why today's CPI release was not a shock


I write this from Italy, so it's going to be short. Today the CPI surprised to the upside. On a year over year basis, the CPI rose 9.1% vs. an expected increase of 8.8%. The Core CPI (ex-food & energy) was a lot less scary, rising 5.9% year over year vs. an expected 5.7%.

Despite there being some rather strong prints (over the past six months, the CPI is up at an annualized rate of 11.1%), the dollar so far is unchanged, 10-yr T-bond yields actually fell a bit (and at 2.9% are still far below inflation), and gold rose only $19/oz, and it is still way below its all-time high of $2032/oz two years ago. Moreover, inflation expectations today are unchanged from yesterday and are relatively modest: 5-yr breakeven inflation rates are 2.5%, and 10-yr BE inflation rates are 2.3%. And as I write this, the stock market is down only 0.5%.

Why is the market so nonplussed? My friend Don Luskin and I both believe it's due to the dramatic deceleration of the M2 money supply since late last year. 


The above chart plots the year over year growth of M2 (white line) and the year over year change in the Core CPI index (orange line). Note in particular that there is about a one-year lag between big changes in M2 growth and big changes in inflation. M2 surged beginning in March 2020, and the CPI started surging about a year later. Then M2 growth started decelerating in March 2021, and the CPI started to fall in April 2022.

Note: I think it's legitimate to use core CPI, because energy prices have been an order of magnitude more volatile than just about any other prices in recent years.

Given that M2 growth has been almost zero for the past 5 months, this exercise would suggest a strong likelihood that we will continue to see Core CPI inflation decelerate in coming months. None of this, of course, is a secret; anyone can run these numbers, and you can bet there are lots of folks in the bond market that have been watching these numbers like hawks for months. That would explain today's lack of surprise.

This theory is also consistent with what I've been suggesting in recent months, which is that this round of Fed tightening will be unlike any other in the past. Why? Because the surge in M2 was a one-off event and it is already history. The market is adjusting to the expectation that the Fed is doing the right thing (i.e., not panicking, but adjusting short-term rates higher in a prudent manner).

Furthermore, this all suggests that the Fed won't need to tighten dramatically or strangle the economy, as it has in the past. My recent posts provide more grist for all of this.

The economy is likely going to survive this bout of inflation without serious consequences. It will be painful for many, to be sure, but the economy needn't collapse.

Wednesday, July 6, 2022

Market to Fed: no need to panic


There has been a significant improvement in the inflation fundamentals in recent weeks. Even though I expect reported inflation to remain uncomfortably high through at least the end of this year, it's becoming clear, on the margin, that the inflation dynamics are improving for the better.

It all began earlier this year when the M2 numbers began to show a significant slowdown, a development I have highlighted at length in previous posts. It's now pretty clear that the surge in M2 was a one-off phenomenon, fueled primarily by a monetization of multi-trillion-dollar-deficits which began in 2020 and continued through at least the third quarter of last year. Since then the federal deficit has plunged and M2 growth has gone flat. The thing that was driving inflation on the margin was money printing designed to enhance the "stimulus" of government handouts, and that has ground to a halt. That's great news, but the lags between money and inflation are "long and variable," according to Milton Friedman. 

There's still a lot of inflation in the pipeline which will be showing up in coming months and quarters, even though the source of rising inflation has been all but extinguished. Soaring housing prices in recent years are now boosting rents, and will do so for at least the rest of this year; rents comprise about 30% of the CPI. Wages and salaries are rising, but they are likely to keep ratcheting up until the economy eventually adjusts to a new, lower-inflation equilibrium, and wages invariably lag rising prices. Energy prices have turned down in a big way in the past month, but lots of other prices are still moving up to offset increased energy costs that were created months ago. Commodity prices are plunging of late, but it will take months before commodity-derived products begin to reflect those lower input costs. And don't forget monthly social security payments, which are due to increase by a significant amount early next year based on the recorded inflation this year, which could well be more than the 5.9% adjustment that was made to 2022 payments. Think of this as "inflation momentum" which will take time to dissipate.

The market is now beginning to look across the valley of still-high inflation this year to the other side, when inflation news will start improving. Markets are good at reading the inflation tea leaves; if only politicians were so smart.

So here are the inflation tea leaves that most impress me, and which can only be the result of a sharp moderation in the growth of M2 money. Taken together, these developments are the polar opposite of what you would expect to see if the Fed were making a too-loose mistake.

Chart #1

Chart #1 compares the level of the dollar (inverted) to an inflation-adjusted index of non-energy commodity prices. A strong dollar has almost always coincided with weak commodity prices, but we saw just the opposite in the past two years. Now, rather suddenly, commodity prices are diving, responding in more typical fashion to the fact that the dollar is quite strong these days. Copper prices are down 30% from their high earlier this month, reversing about half what it gained over the past two years. "Dr. Copper" is famous for reflecting changes in underlying economic and financial fundamentals.

Chart #2

I first created Chart #2 about 40 years ago, and I have been updating it ever since. It's done a pretty good job, over the years, of comparing actual currency values to their "fair value" which is otherwise called purchasing power parity. If my estimates are correct, a dollar spent in Europe at the exchange rate of $1.02 per euro buys roughly 15% more stuff than it does in the U.S. We leave soon for 2 weeks in Italy, and I'll have a chance to test whether my calculations of PPP are correct. 

The larger story is that a strong dollar means the world's demand for dollars is very strong, and that is helping to soak up all the extra M2 that was printed in prior years.

Chart #3

I commented frequently in the past year or so that gold was not moving higher on news that inflation was exceeding expectations because gold rose in anticipation of higher inflation today years ago. The recent weakness in gold is thus best interpreted as the gold market anticipating lower inflation in the years to come.

As the chart suggests, gold has been slow to respond to expectations for higher real interest rates (aka Fed tightening via higher real interest rates), but there is reason to think that gold has begun to catch on; Fed tightening today will result in lower inflation tomorrow.  

Chart #4

Thanks to the introduction of TIPS (Treasury Inflation Protected Securities) in 1997, we have a direct reading of the bond market's inflation expectations are for coming years. It's called the Breakeven Inflation rate, or the rate which will make you indifferent to holding nominal T-bonds or TIPS (and calculated simply by subtracting real rates from nominal rates). The bond market now expects the CPI to average 2.5% a year over the next 5 years, and that's down sharply from an all-time high of 3.6% registered in mid-June. Wow.

Consistent with the improvement in the outlook for inflation contained in these charts, the bond market has adjusted downwards, by a whopping 100 bps, its expectation of the Fed's target rate at the end of 2023 (was 4%, now 3%). 

All good news, of course, especially since it means the risk of recession (typically brought on by a punishingly tight Fed) is likely lower than the broader market thinks. And it's a clear message to the Fed that they needn't (and definitely shouldn't) panic and raise rates too much or too fast.