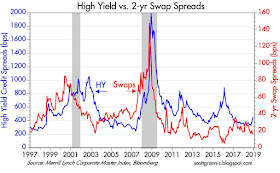
Clearly, the market has lost a tremendous amount of confidence in the staying power of earnings and the health of the economy. Otherwise, stocks today would be a screaming buy relative to just about any other risk asset. Sure, there are lots things to worry about: Trump, China, tariff wars, a US slowdown, and another government "shutdown." But there is nothing preordained about how these worries will be resolved. Lots of things can change, and meanwhile the economy's fundamentals remain rather healthy (fabulous corporate profits, very low unemployment, rising wages, a reasonably strong dollar, unusually high consumer confidence, and very low swap spreads). It's not hard to be optimistic when the market is suddenly so pessimistic.
Chart #1
As Chart #1 shows, PE ratios last January climbed to a high of just over 23 on the strength of corporate tax cuts (and the promise of higher after-tax earnings). Now that the tax cuts are a reality and we've seen the growth in corporate profits, It makes sense for PE ratios to back off a bit. But to a level that is below the long-term average?
Chart #2
Chart #2 shows the difference between the earnings yield on stocks (the inverse of the PE ratio, and the dividend yield that would accompany stocks if corporations paid out all current earnings in the form of dividends), and the risk-free yield on 10-yr Treasury bonds, is 3.3%. Investors currently demand an additional 330 bps of yield in order to accept the perceived additional risk of stocks vis a vis Treasuries. More often than not, however, the equity risk premium is far lower than it is today. During the boom times of the 80s and 90s, the equity risk premium was negative. Investors were so confident in the stock market that they were willing to give up yield in order to benefit from an expected price appreciation. Once again, investors are consumed by pessimism and fear.
Chart #3
Chart #3 shows the latest estimate of after-tax corporate profits (this accompanied last week's revision to Q3/18 GDP figures). Profits surged some 20% in the year ending last September. Similarly, 12-month trailing reported (GAAP) profits grew almost 23% in the year ending last November. And now the market seems to be thinking that all of this will go up in smoke.
Chart #4
Chart #4 shows the ratio of corporate profits to GDP (using the ratio of the two lines in Chart #3). Profits have been running at the historically unprecedented level of 10% of GDP for most of the past 9 years. Maybe this is unlikely to continue; maybe profits fall back to 8% of GDP. That would still be well above the long-term average. Why shouldn't PE ratios also trade above their long-term average, especially considering the generally low level of interest rates?
Chart #5
Chart #5 compares the earnings yield on stocks to the yield on BAA corporate bonds (a decent proxy for all corporate bond yields). Corporate bondholders get first claim on corporate profits, with equity holders last in line. Since the yield on corporate bonds is safer than the returns promised to equity holders, it only makes sense for equity investors to accept a lower earnings yield—as they did for most of the 80s, 90s, and early 00s—because they expect to receive capital gains in the future (which in turn implies an optimistic outlook). The periods during which the reverse held (i.e., when earnings yields exceeded bond yields) were generally dominated by fear: e.g., the late 1970s, and the years following the Great Recession, and now. Today, the fact that earnings yields exceed corporate bond yields is a sign that investors are worried about the future and are thus willing to pay a premium for the safety of corporate bonds. (Note: This paragraph has been re-written from its original version to more accurately and correctly describe the message of Chart #5.)
Chart #6
Chart #6 compares the market's worry levels (the Vix/10-yr ratio) to the level of stock prices. We're deep within another bout of anxiety, and prices have fallen some 18% from their recent all-time high. It's not hard to imagine fear reaching even higher levels—commensurate with prior episodes of panic attacks—and prices even lower levels. But at today's levels prices are "vulnerable" to any good news. Maybe the Fed will reconsider its plan to raise rates twice next year; maybe China will deal (actually they already are offering concessions); maybe the government shutdown won't prove any more painful than before.
Some words of wisdom distilled from several famous investors: 1) The price of a stock is only important on the day you have to sell it. 2) One should delight when stocks become cheap, not despair.
UPDATE (12/24/18: 10:00 PST) Looks like the panic is close to reaching levels associated with the worst of past selloffs. Here's the latest version of Chart #6:
UPDATE (12/24/18: 10:00 PST) Looks like the panic is close to reaching levels associated with the worst of past selloffs. Here's the latest version of Chart #6:


