As the chart above shows, TIPS give us direct insight into the market's inflation expectations. Subtracting the real yield on 5-yr TIPS (blue line) from the nominal yield on 5-yr Treasuries tells us the market's implied inflation forecast, which today is 1.6% (i.e., the market expects the CPI to average 1.6% over the next 5 years). Although this is a bit below the Fed's professed target of 2% or so, it is very much within the range of historical experience, and nothing to be concerned about.

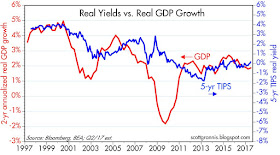
As the chart above suggests, the real yield on TIPS also gives us insight into the market's expectations for real economic growth. Real yields on 5-yr TIPS have generally tracked the economy's trend growth rate for the past two decades. Real yields have traded in a narrow and relatively stable range (but with a modest upward trend) for the past four years, and real GDP growth has averaged about 2% over this same period. When real growth averaged over 4% in the late 1990s, real yields on TIPS were just under 4%. That risk free real yields on TIPS should tend to be somewhat less than the real growth of the economy should come as no surprise. The best investors can hope for from the broad market on average is whatever real growth happens to be, whereas TIPS guarantee a real rate of return ex-ante. A bird in the hand should always be worth more (yield less) than two in the bush.
Skeptics might object that TIPS and Treasury prices have been distorted by massive QE-related Fed purchases. But the chart above, which compares the Fed's share of marketable Treasuries to their yield, shows little if any reliable correlation between the two. Today the Fed owns just under 18% of outstanding marketable Treasury debt, and that is about the same share as they held in the pre-2007 period—yet yields today are less than half what they were back then. The Fed currently holds about 9% of outstanding marketable TIPS, so Fed purchases of TIPS have had even less impact on the TIPS market than on the Treasury market.
Not surprisingly, the real yield on TIPS today is heavily influenced by ex-post real yields on Treasuries, as the chart above shows. Fed purchases of TIPS, in other words, are not distorting the real yields on TIPS today. Market-driven real yields are grounded in observable real yields over recent history. And the difference between Treasury and TIPS yields (expected inflation) is very much in line with historical inflation. Again, there is no evidence to suggest that the Fed or the market is distorting the prices or the message of TIPS and Treasuries.
Real yields on 5-yr TIPS are by definition the market's expectation for what the real yield on the Fed's fund rate target will average over the next 5 years. There's an arbitrage that makes this work: you can invest in the Fed funds market for five years or you can buy 5-yr TIPS; in the presence of liquid markets it is reasonable to think that the expected real yield of both strategies is approximately equal.
The Fed makes much of its nominal interest rate target, but it is the real yield on the funds rate that is the most important, and it plays a key role in the Fed's deliberations. Low nominal yields sound like "easy" money, but money is really easy only when real borrowing costs are negative, as has been the case throughout the current business cycle expansion. Real overnight yields are now rising, and beginning to be positive in real terms. That is fully consistent with the Fed's belief that the real equilibrium funds rate is rising as well, since the economy is enjoying improving economic fundamentals (e.g., a low rate of unemployment, steady jobs growth, improving confidence, low implied volatility, low and stable inflation, and reduced regulatory burdens). The current real yield on 5-yr TIPS strongly suggests that the market is expecting the Fed to continue to increase short-term real and nominal rates in coming years, but not by very much. In fact, the market currently expects the Fed to raise its target rate only twice over the next 18 months.
It's also worth noting that the prices of 5-yr TIPS (as proxied in the chart above by using the inverse of their real yield) have been positively correlated with gold prices over the past 10 years or so. This is rather remarkable, given that these two assets are fundamentally different in almost every respect. The one characteristic they share, I would argue, is that both are "safe havens" of a sort. Gold protects against all sorts of risks to one's purchasing power, and TIPS protect against the ravages of inflation of a monetary origin.
Higher real yields on TIPS would therefore be a signal that the market is expecting stronger real growth in coming years. We already see a hint of that in the modest upward trend in TIPS real yields over the past four years, as evidenced in the chart below:
One other thing that we can deduce from this analysis is that there is little if any evidence that the market is overly optimistic about the prospects for US growth. Thus, if Trump and Congress manage to deliver serious tax and regulatory reform, then I would expect to see much higher real yields, much lower gold prices, and a stronger stock market.


